Rusalov STQ-150 and Rusalov-Trofimova STQ-77 in Relation to the EEG Spectral Power
Abstract
Abstract
In our studies of the psychophysiology of acoustic perception and musical preferences in 2018 and 2019, we used the temperament and character questionnaires: Rusalov’s STQ-150, Rusalov & Trofimova’s OST-77, and the Russian version of the Cloninger’s TCI. Current paper summarizes the found correlations between the scales of these questionnaires and the spectral power of the EEG in traditional bands, in various leads. It has to be admitted that in the current study STQ-150 has shown remarkable correspondence of the results to Rusalov’s initial findings (1979). On the other hand, STQ-77 and TCI-140 results are quite similar and at the same time different from Rusalov’s original STQ -150 regarding the slow waves. In order to find out in how far this is determined by the experimental settings further studies are required. Nevertheless, it is quite obvious that slow waves spectral power especially that of the Theta band are the best at registering emotional states.
In general, the results of the Inventories are in good agreement with each other and are well interpreted from the standpoint of the contemporary psychophysiology. Rusalov & Trofimova’s STQ-77 should be recognized as especially effective.
В наших исследованиях психофизиологии акустического восприятия и музыкальных предпочтений в 2018 и 2019 годах мы использовали опросники темперамента и характера: STQ-150 Русалова, STQ-77 Русалова и Трофимовой и русскую версию ТКИ Клонингера. В настоящей статье обобщены обнаруженные корреляции между шкалами этих опросников и спектральной мощностью ЭЭГ в традиционных диапазонах в различных отведениях. Надо признать, что в настоящем исследовании STQ-150 показал поразительное соответствие результатов первоначальным выводам В.М. Русалова (1979). С другой стороны, результаты STQ-77 и TCI-140 весьма схожи и в то же время отличаются от оригинального STQ-150 Русалова в отношении медленных волн. Чтобы выяснить, в какой степени это определяется условиями эксперимента, необходимы дальнейшие исследования. Тем не менее, совершенно очевидно, что спектральная мощность медленных волн, особенно тета-диапазона, лучше всего подходит для регистрации эмоциональных состояний.
В целом полученные результаты хорошо согласуются друг с другом и хорошо интерпретируются с позиций современной психофизиологии. Особенно эффективным следует признать STQ-77 Русалова и Трофимовой.
Ключевые слова: мощность ЭЭГ, акустические стимулы, темп, громкость, полосы ЭЭГ, отведения, личностные качества, темперамент, характер, опросники.
Introduction
Although the results of this study were partially presented earlier in the conference paper in Russian (Almaev et al., 2020) and in the Manual of the Structure of Temperament Questionnaire (Rusalov & Trofimova, 2023), all of the related tables were never published and discussed before in their completeness.
From the general considerations, approach in which data of personality inventories are related to the EEG spectral power in resting state may seem not to be sufficiently robust. Nevertheless, their results are quite consistent and reasonably interpretable (Vacker & Gatt, 2010, Knyazev, 2010; Koehler et al., 2011).
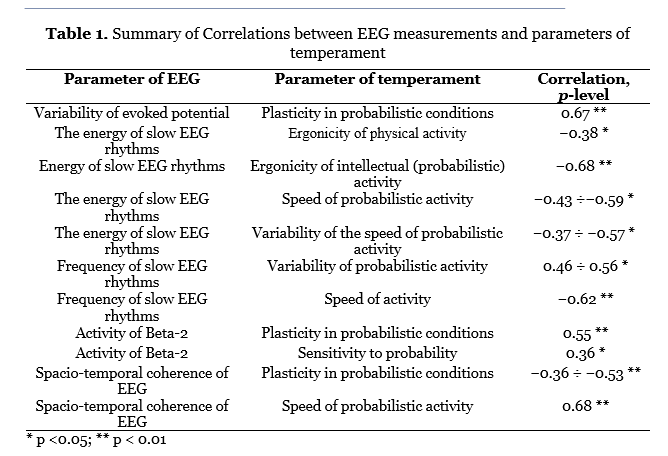
Table 1. Summary of Correlations between EEG measurements and parameters of temperament
| Parameter of EEG | Parameter of temperament | Correlation,
p-level |
| Variability of evoked potential | Plasticity in probabilistic conditions | 0.67 ** |
| The energy of slow EEG rhythms | Ergonicity of physical activity | −0.38 * |
| Energy of slow EEG rhythms | Ergonicity of intellectual (probabilistic) activity | −0.68 ** |
| The energy of slow EEG rhythms | Speed of probabilistic activity | −0.43 ÷−0.59 * |
| The energy of slow EEG rhythms | Variability of the speed of probabilistic activity | −0.37 ÷ −0.57 * |
| Frequency of slow EEG rhythms | Variability of probabilistic activity | 0.46 ÷ 0.56 * |
| Frequency of slow EEG rhythms | Speed of activity | −0.62 ** |
| Activity of Beta-2 | Plasticity in probabilistic conditions | 0.55 ** |
| Activity of Beta-2 | Sensitivity to probability | 0.36 * |
| Spacio-temporal coherence of EEG | Plasticity in probabilistic conditions | −0.36 ÷ −0.53 ** |
| Spacio-temporal coherence of EEG | Speed of probabilistic activity | 0.68 ** |
Original Rusalov’s findings regarding EEG bands and temperamental traits registered in different experiments and by his first inventory STQ-150 are presented in Table 1. (Adopted by Rusalov & Trofimova, 2023). Trofimova’s innovations stem mostly from the neurochemical framework, they incorporate the findings of the last decades in the studies of neurotransmitters and hormones. This brings STQ-77 closer to Cloninger’s TCI-240 model (Cloninger et al., 1994) and our TCI-140 adaptation for the Russian sample (Almayev & Ostrovskaya, 2005), although they of course have some differences between them.
Table 2. Total number of correlations between power in traditional EEG ranges, two STQ versions, Extended (STQ-150) and Compact (STQ-77) and Cloninger’s TCI-140 (Almayev, et al, 2020)
| Item\Inventory | STQ-150 | STQ-77 | TCI-140 |
| Sample | N = 28 | N = 24 | N = 24 |
| Total N of correlations, p < 0.05 | 37 | 87 | 91 |
| Delta | 6 | 12 | 13 |
| Theta | 6 | 50 | 27 |
| Alpha | 7 | 2 | 4 |
| Beta 1 | 11 | 9 | 15 |
| Beta 2 | 7 | 3 | 14 |
| Gamma | 0 | 11 | 18 |
As it was found, the STQ-77 appeared to have more substantial differential power for EEG biomarkers in comparison to the STQ-150 and the TCI-140. The large number of significant correlations between the TCI scales and the EEG indices was mainly due to the correlations with the TCI validity scales or the TCI summing indices rather than correlations with the temperament or character scales of this test. In contrast, statistically significant correlations with the STQ-77 mainly showed up in temperament scales (Tab. 2).
Method
We studied individual differences in the psychophysiology of perception of sound, music and musical preferences. Several methods were used, including EEG, the Extended STQ (STQ-150) (in 2018, 28 adult participants, M/F = 14/14) and the Compact STQ (STQ-77) (in 2019, 24 adult participants, M/F = 13/11, M age = 23.2, SD = 4.9). In the second study, was also used Cloninger’s Temperament and Character Inventory (TCI-140), Russian version, for comparison of the differential power of these methods.
The samples of the first and the second studies didn’t cross except 2−3 subjects. In both samples, EEG recording was conducted before testing with the STQ and experimental exposure to the sound stimuli. In the both cases the data under analyses was recorded with subjects eyes closed.
Mitsar 202-1 encephalograph was used, 21 electrodes mounted according to 10−20 system. Rejection of artifacts in the both studies was mainly automatic by Mitsar software with the following parameters identical in both cases: amplitude threshold 200 μv, slow wave amplitude threshold 100 μv. Slow waves frequency from 0 to 1 Hz. Fast waves amplitude threshold 100 μv, fast waves frequency from 25 to 30Hz, interval cleared before an artifact – 200 msec, after an artefact – 200 msec.
Nevertheless, one condition was substantially different in the experimental settings. In the first study (STQ-150) the stimuli were presented by the noise like sounds of the different intensity, while in the second one they were the favourite musical compositions of the participants, deliberately chosen by them in beforehand. This condition can be the possible influencing factor due to the expectations of the subjects. This difference has to be kept in mind especially regarding the differences in slow waves (Delta and Theta bands).
Results
1.1. Delta band
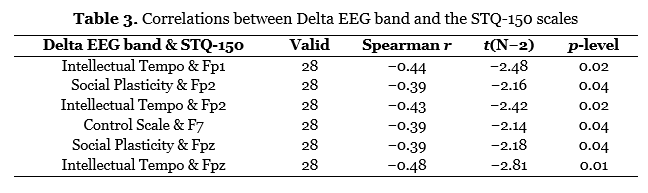
The spectral power in the lower frontal areas generating this band (Fp1, Fp2, Fpz) had a significant negative correlation with the STQ-150 scales of Intellectual Tempo and Social Plasticity (Tab. 3).
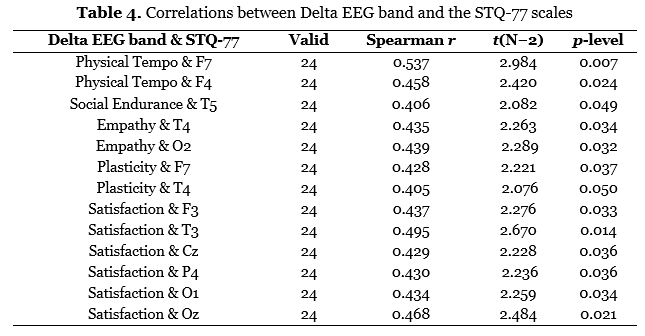
Twelve scales of the STQ77 had significant positive correlations with this band: six correlations with the Satisfaction scale, two with the Empathy scale (T4, O2), one with the Social Endurance scale (T5), two with the Physical Tempo scale (F7, p = 0.007 and F4) and one with the Plasticity scale (F7) (Tab. 4).
Table 3. Correlations between Delta EEG band and the STQ-150 scales
| Delta EEG band & STQ-150 | Valid | Spearman r | t(N−2) | p-level |
| Intellectual Tempo & Fp1 | 28 | −0.44 | −2.48 | 0.02 |
| Social Plasticity & Fp2 | 28 | −0.39 | −2.16 | 0.04 |
| Intellectual Tempo & Fp2 | 28 | −0.43 | −2.42 | 0.02 |
| Control Scale & F7 | 28 | −0.39 | −2.14 | 0.04 |
| Social Plasticity & Fpz | 28 | −0.39 | −2.18 | 0.04 |
| Intellectual Tempo & Fpz | 28 | −0.48 | −2.81 | 0.01 |
Table 4. Correlations between Delta EEG band and the STQ-77 scales
| Delta EEG band & STQ-77 | Valid | Spearman r | t(N−2) | p-level |
| Physical Tempo & F7 | 24 | 0.537 | 2.984 | 0.007 |
| Physical Tempo & F4 | 24 | 0.458 | 2.420 | 0.024 |
| Social Endurance & T5 | 24 | 0.406 | 2.082 | 0.049 |
| Empathy & T4 | 24 | 0.435 | 2.263 | 0.034 |
| Empathy & O2 | 24 | 0.439 | 2.289 | 0.032 |
| Plasticity & F7 | 24 | 0.428 | 2.221 | 0.037 |
| Plasticity & T4 | 24 | 0.405 | 2.076 | 0.050 |
| Satisfaction & F3 | 24 | 0.437 | 2.276 | 0.033 |
| Satisfaction & T3 | 24 | 0.495 | 2.670 | 0.014 |
| Satisfaction & Cz | 24 | 0.429 | 2.228 | 0.036 |
| Satisfaction & P4 | 24 | 0.430 | 2.236 | 0.036 |
| Satisfaction & O1 | 24 | 0.434 | 2.259 | 0.034 |
| Satisfaction & Oz | 24 | 0.468 | 2.484 | 0.021 |
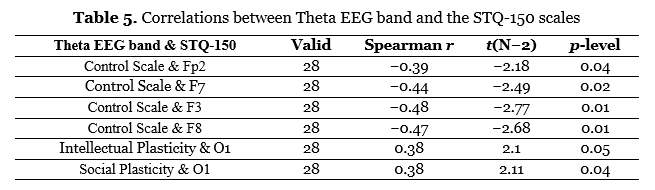
The STQ-150 had six significant correlations with this band, four of which were negative, with the Validity (social desirability) scale (Fp2, F7, F3, F8). This can be interpreted as also negative correlation of the slow waves with intellectual functions. (Tab 5). The STQ-150 scales of Intellectual and Emotional Plasticity both had positive correlation with O1. Correlations with O1 are apparently artifact caused by the «eyes closed» condition.
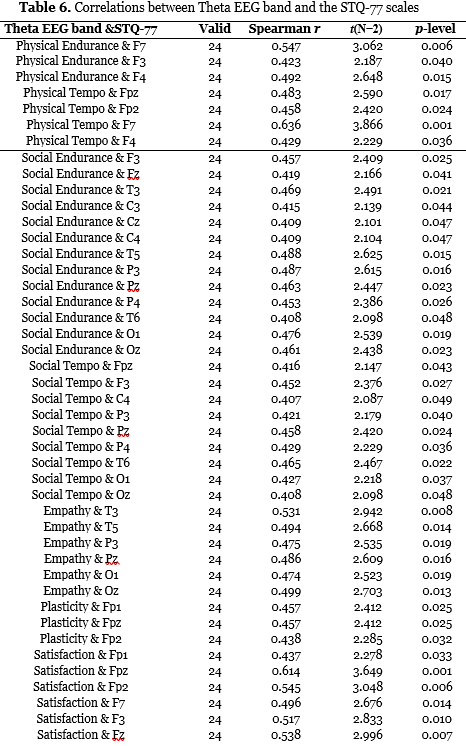
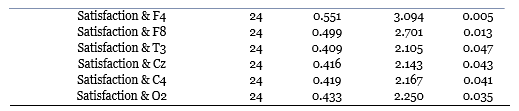
The STQ-77 has 50 statistically significant correlations with this band. Twenty-eight of them were with social scales: Social Endurance, Social Tempo and Empathy, and 12 with the Satisfaction scale (Tab. 6).
Table 5. Correlations between Theta EEG band and the STQ-150 scales
| Theta EEG band & STQ-150 | Valid | Spearman r | t(N−2) | p-level |
| Control Scale & Fp2 | 28 | −0.39 | −2.18 | 0.04 |
| Control Scale & F7 | 28 | −0.44 | −2.49 | 0.02 |
| Control Scale & F3 | 28 | −0.48 | −2.77 | 0.01 |
| Control Scale & F8 | 28 | −0.47 | −2.68 | 0.01 |
| Intellectual Plasticity & O1 | 28 | 0.38 | 2.1 | 0.05 |
| Social Plasticity & O1 | 28 | 0.38 | 2.11 | 0.04 |
Table 6. Correlations between Theta EEG band and the STQ-77 scales
| Theta EEG band &STQ-77 | Valid | Spearman r | t(N−2) | p-level |
| Physical Endurance & F7 | 24 | 0.547 | 3.062 | 0.006 |
| Physical Endurance & F3 | 24 | 0.423 | 2.187 | 0.040 |
| Physical Endurance & F4 | 24 | 0.492 | 2.648 | 0.015 |
| Physical Tempo & Fpz | 24 | 0.483 | 2.590 | 0.017 |
| Physical Tempo & Fp2 | 24 | 0.458 | 2.420 | 0.024 |
| Physical Tempo & F7 | 24 | 0.636 | 3.866 | 0.001 |
| Physical Tempo & F4 | 24 | 0.429 | 2.229 | 0.036 |
| Social Endurance & F3 | 24 | 0.457 | 2.409 | 0.025 |
| Social Endurance & Fz | 24 | 0.419 | 2.166 | 0.041 |
| Social Endurance & T3 | 24 | 0.469 | 2.491 | 0.021 |
| Social Endurance & C3 | 24 | 0.415 | 2.139 | 0.044 |
| Social Endurance & Cz | 24 | 0.409 | 2.101 | 0.047 |
| Social Endurance & C4 | 24 | 0.409 | 2.104 | 0.047 |
| Social Endurance & T5 | 24 | 0.488 | 2.625 | 0.015 |
| Social Endurance & P3 | 24 | 0.487 | 2.615 | 0.016 |
| Social Endurance & Pz | 24 | 0.463 | 2.447 | 0.023 |
| Social Endurance & P4 | 24 | 0.453 | 2.386 | 0.026 |
| Social Endurance & T6 | 24 | 0.408 | 2.098 | 0.048 |
| Social Endurance & O1 | 24 | 0.476 | 2.539 | 0.019 |
| Social Endurance & Oz | 24 | 0.461 | 2.438 | 0.023 |
| Social Tempo & Fpz | 24 | 0.416 | 2.147 | 0.043 |
| Social Tempo & F3 | 24 | 0.452 | 2.376 | 0.027 |
| Social Tempo & C4 | 24 | 0.407 | 2.087 | 0.049 |
| Social Tempo & P3 | 24 | 0.421 | 2.179 | 0.040 |
| Social Tempo & Pz | 24 | 0.458 | 2.420 | 0.024 |
| Social Tempo & P4 | 24 | 0.429 | 2.229 | 0.036 |
| Social Tempo & T6 | 24 | 0.465 | 2.467 | 0.022 |
| Social Tempo & O1 | 24 | 0.427 | 2.218 | 0.037 |
| Social Tempo & Oz | 24 | 0.408 | 2.098 | 0.048 |
| Empathy & T3 | 24 | 0.531 | 2.942 | 0.008 |
| Empathy & T5 | 24 | 0.494 | 2.668 | 0.014 |
| Empathy & P3 | 24 | 0.475 | 2.535 | 0.019 |
| Empathy & Pz | 24 | 0.486 | 2.609 | 0.016 |
| Empathy & O1 | 24 | 0.474 | 2.523 | 0.019 |
| Empathy & Oz | 24 | 0.499 | 2.703 | 0.013 |
| Plasticity & Fp1 | 24 | 0.457 | 2.412 | 0.025 |
| Plasticity & Fpz | 24 | 0.457 | 2.412 | 0.025 |
| Plasticity & Fp2 | 24 | 0.438 | 2.285 | 0.032 |
| Satisfaction & Fp1 | 24 | 0.437 | 2.278 | 0.033 |
| Satisfaction & Fpz | 24 | 0.614 | 3.649 | 0.001 |
| Satisfaction & Fp2 | 24 | 0.545 | 3.048 | 0.006 |
| Satisfaction & F7 | 24 | 0.496 | 2.676 | 0.014 |
| Satisfaction & F3 | 24 | 0.517 | 2.833 | 0.010 |
| Satisfaction & Fz | 24 | 0.538 | 2.996 | 0.007 |
| Satisfaction & F4 | 24 | 0.551 | 3.094 | 0.005 |
| Satisfaction & F8 | 24 | 0.499 | 2.701 | 0.013 |
| Satisfaction & T3 | 24 | 0.409 | 2.105 | 0.047 |
| Satisfaction & Cz | 24 | 0.416 | 2.143 | 0.043 |
| Satisfaction & C4 | 24 | 0.419 | 2.167 | 0.041 |
| Satisfaction & O2 | 24 | 0.433 | 2.250 | 0.035 |
Alpha band
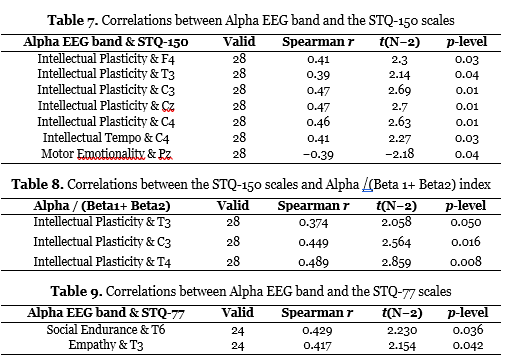
This band has five positive statistically significant correlations in the central region with the STQ-150 scale of Intellectual Plasticity (in F4, T3, C3, Cz, C4), a positive significant correlation with the STQ-150 Intellectual Tempo (C4) and a negative significant correlation with the STQ-150 scale of Motor Emotionality (in Pz) (Table 7).
Regarding the STQ-77, this band has shown positive significant correlations with the scales of Social Endurance (T6) and Empathy (T3) (Table 9). Cloninger’s TCI has also only two correlations with Alpha band.
Table 7. Correlations between Alpha EEG band and the STQ-150 scales
| Alpha EEG band & STQ-150 | Valid | Spearman r | t(N−2) | p-level |
| Intellectual Plasticity & F4 | 28 | 0.41 | 2.3 | 0.03 |
| Intellectual Plasticity & T3 | 28 | 0.39 | 2.14 | 0.04 |
| Intellectual Plasticity & C3 | 28 | 0.47 | 2.69 | 0.01 |
| Intellectual Plasticity & Cz | 28 | 0.47 | 2.7 | 0.01 |
| Intellectual Plasticity & C4 | 28 | 0.46 | 2.63 | 0.01 |
| Intellectual Tempo & C4 | 28 | 0.41 | 2.27 | 0.03 |
| Motor Emotionality & Pz | 28 | −0.39 | −2.18 | 0.04 |
Table 8. Correlations between the STQ-150 scales and Alpha /(Beta 1+ Beta2) index
| Alpha / (Beta1+ Beta2) | Valid | Spearman r | t(N−2) | p-level |
| Intellectual Plasticity & T3 | 28 | 0.374 | 2.058 | 0.050 |
| Intellectual Plasticity & C3 | 28 | 0.449 | 2.564 | 0.016 |
| Intellectual Plasticity & T4 | 28 | 0.489 | 2.859 | 0.008 |
Table 9. Correlations between Alpha EEG band and the STQ-77 scales
| Alpha EEG band & STQ-77 | Valid | Spearman r | t(N−2) | p-level |
| Social Endurance & T6 | 24 | 0.429 | 2.230 | 0.036 |
| Empathy & T3 | 24 | 0.417 | 2.154 | 0.042 |
Beta 1 band
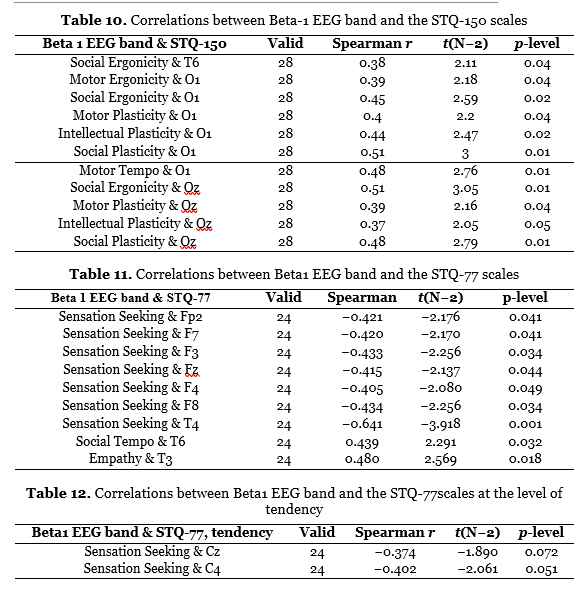
Originally (see Table 1) there was no information about Beta1 band. Correlations with occipital leads are also far from having obvious explanation (Table 10). Nine correlations with STQ77 scales found in this band, seven of them negative with sensation seeking (Table 11). There are two correlations between Beta1 EEG band and the STQ-77scales on the level of tendency (Table 12).
Table 10. Correlations between Beta-1 EEG band and the STQ-150 scales
| Beta 1 EEG band & STQ-150 | Valid | Spearman r | t(N−2) | p-level |
| Social Ergonicity & T6 | 28 | 0.38 | 2.11 | 0.04 |
| Motor Ergonicity & O1 | 28 | 0.39 | 2.18 | 0.04 |
| Social Ergonicity & O1 | 28 | 0.45 | 2.59 | 0.02 |
| Motor Plasticity & O1 | 28 | 0.4 | 2.2 | 0.04 |
| Intellectual Plasticity & O1 | 28 | 0.44 | 2.47 | 0.02 |
| Social Plasticity & O1 | 28 | 0.51 | 3 | 0.01 |
| Motor Tempo & O1 | 28 | 0.48 | 2.76 | 0.01 |
| Social Ergonicity & Oz | 28 | 0.51 | 3.05 | 0.01 |
| Motor Plasticity & Oz | 28 | 0.39 | 2.16 | 0.04 |
| Intellectual Plasticity & Oz | 28 | 0.37 | 2.05 | 0.05 |
| Social Plasticity & Oz | 28 | 0.48 | 2.79 | 0.01 |
Table 11. Correlations between Beta1 EEG band and the STQ-77 scales
| Beta 1 EEG band & STQ-77 | Valid | Spearman | t(N−2) | p-level |
| Sensation Seeking & Fp2 | 24 | −0.421 | −2.176 | 0.041 |
| Sensation Seeking & F7 | 24 | −0.420 | −2.170 | 0.041 |
| Sensation Seeking & F3 | 24 | −0.433 | −2.256 | 0.034 |
| Sensation Seeking & Fz | 24 | −0.415 | −2.137 | 0.044 |
| Sensation Seeking & F4 | 24 | −0.405 | −2.080 | 0.049 |
| Sensation Seeking & F8 | 24 | −0.434 | −2.256 | 0.034 |
| Sensation Seeking & T4 | 24 | −0.641 | −3.918 | 0.001 |
| Social Tempo & T6 | 24 | 0.439 | 2.291 | 0.032 |
| Empathy & T3 | 24 | 0.480 | 2.569 | 0.018 |
Table 12. Correlations between Beta1 EEG band and the STQ-77scales at the level of tendency
| Beta1 EEG band & STQ-77, tendency | Valid | Spearman r | t(N−2) | p-level |
| Sensation Seeking & Cz | 24 | −0.374 | −1.890 | 0.072 |
| Sensation Seeking & C4 | 24 | −0.402 | −2.061 | 0.051 |
Beta 2 band
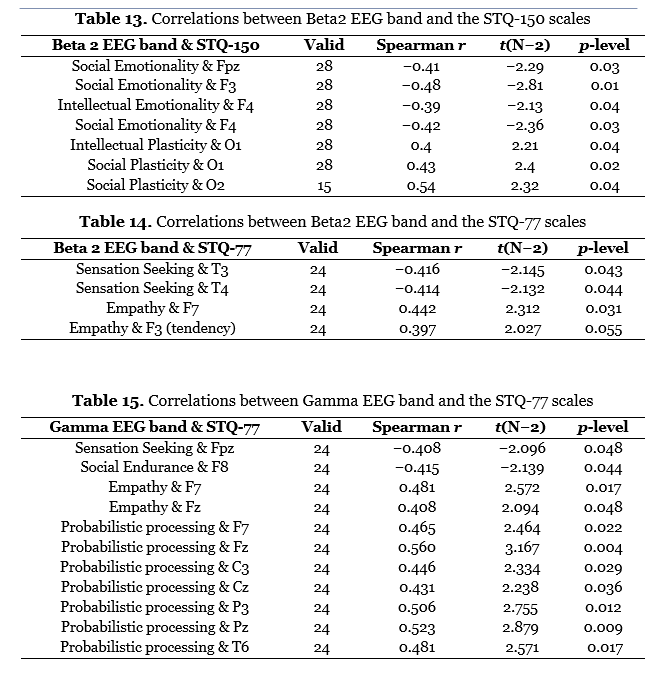
Seven significant correlations were found between this band and the STQ-150 scales. Four of them are negative with emotionality (Table 13). No significant correlations were found between Gamma EEG band and the scales of STQ-150 (Table 14).
Table 13. Correlations between Beta2 EEG band and the STQ-150 scales
| Beta 2 EEG band & STQ-150 | Valid | Spearman r | t(N−2) | p-level |
| Social Emotionality & Fpz | 28 | −0.41 | −2.29 | 0.03 |
| Social Emotionality & F3 | 28 | −0.48 | −2.81 | 0.01 |
| Intellectual Emotionality & F4 | 28 | −0.39 | −2.13 | 0.04 |
| Social Emotionality & F4 | 28 | −0.42 | −2.36 | 0.03 |
| Intellectual Plasticity & O1 | 28 | 0.4 | 2.21 | 0.04 |
| Social Plasticity & O1 | 28 | 0.43 | 2.4 | 0.02 |
| Social Plasticity & O2 | 15 | 0.54 | 2.32 | 0.04 |
Table 14. Correlations between Beta2 EEG band and the STQ-77 scales
| Beta 2 EEG band & STQ-77 | Valid | Spearman r | t(N−2) | p-level |
| Sensation Seeking & T3 | 24 | −0.416 | −2.145 | 0.043 |
| Sensation Seeking & T4 | 24 | −0.414 | −2.132 | 0.044 |
| Empathy & F7 | 24 | 0.442 | 2.312 | 0.031 |
| Empathy & F3 (tendency) | 24 | 0.397 | 2.027 | 0.055 |
Gamma band had 11 significant correlations with the STQ-77 scales. Out of these, seven positive correlations were with the scale of Probabilistic Processing (F7, Fz; p = 0.004, C3, Cz, P3, Pz; p = 0.009, T6) (Table 15).
Table 15. Correlations between Gamma EEG band and the STQ-77 scales
| Gamma EEG band & STQ-77 | Valid | Spearman r | t(N−2) | p-level |
| Sensation Seeking & Fpz | 24 | −0.408 | −2.096 | 0.048 |
| Social Endurance & F8 | 24 | −0.415 | −2.139 | 0.044 |
| Empathy & F7 | 24 | 0.481 | 2.572 | 0.017 |
| Empathy & Fz | 24 | 0.408 | 2.094 | 0.048 |
| Probabilistic processing & F7 | 24 | 0.465 | 2.464 | 0.022 |
| Probabilistic processing & Fz | 24 | 0.560 | 3.167 | 0.004 |
| Probabilistic processing & C3 | 24 | 0.446 | 2.334 | 0.029 |
| Probabilistic processing & Cz | 24 | 0.431 | 2.238 | 0.036 |
| Probabilistic processing & P3 | 24 | 0.506 | 2.755 | 0.012 |
| Probabilistic processing & Pz | 24 | 0.523 | 2.879 | 0.009 |
| Probabilistic processing & T6 | 24 | 0.481 | 2.571 | 0.017 |
Discussion
1.1. Delta band
As we can see regarding Delta band there is exact correspondence between Rusalov’s original findings (Tab. 1) and our ones (Table 3). Slowest waves correlate negatively with the intellectual scales, especially in the frontal leads. Twelve scales of the STQ77 had significant positive correlations with this band: six correlations with the Satisfaction scale, two with the Empathy scale (T4, O2), one with the Social Endurance scale (T5), two with the Physical Tempo scale (F7, p = 0.007 and F4) and one with the Plasticity scale (F7) (Table 4). At least the results of the “Satisfaction” scale are susceptible in regards to the experimental settings influence. TCI-140 had 13 correlations mostly positive with Responsibility and Harmonic second nature (good habits).
1.2. Theta band
Four of STQ-150 significant negative correlations, with the Validity (social desirability) scale can be interpreted also as the negative association of the slow waves with intellectual functions. (Table 5). The STQ-150 scales of Intellectual and Emotional Plasticity both had positive correlation with O1. Correlations with O1 are apparently artifact caused by the “eyes closed” condition.
Regarding the STQ-77 we suggest that the positive association of this band with the Satisfaction scale probably reflects this study’s overall positive emotional background. The Theta band also had three positive correlations with the STQ-77 Plasticity (Fp1, Fpz, Fp2), three positive correlations with the STQ-77 Physical Endurance (F7, p = 0.006; F3, F4) and four positive correlations with the STQ-77 Physical Tempo scale (F7, p = 0.001; Fpz, Fp2, F4). The TCI-140 results are close to that of the STQ -77: 9 correlation of Theta band with Sentimentality (Reward-Dependence Scale #1) and 11 with Hypertrophied empathy (Self-Transcendence scale #2) – all positive.
1.3. Alpha band
This band has five positive statistically significant correlations in the central region with the STQ-150 scale of Intellectual Plasticity (in F4, T3, C3, Cz, C4), a positive significant correlation with the STQ-150 Intellectual Tempo (C4) and a negative significant correlation with the with STQ-150 scale of Motor Emotionality (in Pz). The last correlation permits to think that the plasticity here is a positive trend that permits deliberately switch from one activity to another. On the other hand well-known index Alpha /(Beta1+ Beta2) which widely accepted as staying for distraction vs. concentration, correlates with Intellectual Plasticity positively thus advocating for the prevailing distraction (see Tab. 8).
1.4. Beta1 band
The STQ-150 showed 11 statistically significant correlations with the spectral power in this range. All three types of Ergonicity and all three types of Plasticity of the STQ-150 had positive correlations with the O1, O2, and one at T6. Motor Tempo also positively correlated with the O2 (Tab. 10). Probably, it has to be taken into consideration that activity was registered during eyes closed. Observed correlation may be due to the well-known rise of activity in the occipital-parietal area in this condition. The STQ-77 has nine positive significant correlations with the spectral power in the Beta1 range. Seven of these correlations were negative associations between the Sensation Seeking scale and Fp2, F7, F3, Fz, F4, F8, and T4. This can be interpreted as the inhibitory function of the prefrontal cortex. There were also significant positive correlations between this band and the STQ-77 scales of Social Tempo (T6) and Empathy (T3). There are also two correlations at the level of tendency (tab. 12). According to our understanding these correlations show gradually weakening spread of inhibitory activity up to the central leads. Cloninger’s TCI revealed 12 correlations all of them positive and with Reward dependence scales.
1.5. Beta2 band
According to Rusalov’s theory Emotionality means rise of entropy and generally decay and malfunction of the corresponding activities. Therefore, negative correlations with different types of emotionality in the frontal leads mean effectiveness of corresponding activities (tab.12). Thus, obtained results match Rusalov’s initial findings regarding Beta 2 band (see tab.13). Previously (Almayev, et al., 2020) we’ve pointed out the opposite impact of Emotionality and Plasticity on this band. Normally, the plasticity of behavior involves the suppression of emotional impulses by the higher activity of the prefrontal cortex. When these impulses are not sufficient in cases of weak prefrontal control, the plasticity of behavior turns into distraction. Correlations of Beta-2 with STQ-77 continues the line of correlation with Beta 1 on the inhibitory activity of prefrontal cortex being spread on the lateral central leads. Empathy is detected as the fast wave activity according to it. The results of the Cloninger’s TCI are in the correspondence with these findings: there are 6 negative correlations with Impulsivity and Extravagancy all in the frontal leads, and 2 positive correlations with Sentimentality (O2).
1.6. Gamma band
We suggest that the Probabilistic Processing scale of the STQ-77 adequately reflects the gamma-spectrum of brain electric activity (tab. 15). It also has to be noted that this activity was primarily registered from the left hemisphere of the scale without any signs of frontal-occipital opposition. There were also two significant positive correlations between the Empathy scale and F7, Fz, and a negative correlation between the Sensation-seeking scale and Fpz, as well as between the Social Endurance scale and F8. In the case of Sensation-seeking Gamma activity can be interpreted the same way as in the case of Beta 1 and Beta 2 as the inhibitory one, produced by the Prefrontal cortex. Cloninger’s TCI had totally 18 correlations with Gamma band, In the TTX-140 test there is no self-assessment scale similar to “Intelligence” in OST-77, but it is all the more interesting that its close functional analogue turned out to be the “Agreement/ Negativism” control scale, which negatively correlates with the power of the Gamma range in seven leads Fpz, F8, Fz, F7, C3 , T3, T4. The lower the Gamma band power value in these leads, the higher is the tendency to answer “yes” to questions in the test. That is, an increase in activity in the Gamma range in these leads can be interpreted as increased vigilance. Another three of them correlate negatively with Extravagancy in frontal leads and Cz, thus behaving the same way as in the case of Beta 2 band.
1.7. Existenz Skale
As it is mentioned in (Almayev et al., 2020) we have also used Existenz Skale by Laengle et al. (2020) in the Russian adaptation by Mainina and Vasanov (2011). It is rather specific questionnaire of 46 items and four subscales that doesn’t correspond to the structure of a personality inventory. Nevertheless, the general situation with its’ results (p<0.05) and the EEG bands is the same as for the inventories described above: Delta – 41 correlations, Theta – 60 correlations (more than in STQ-77), Alpha – 3 correlations, Beta 1 – none, Beta 2 – 5, Gamma – none.
Items of the scales from different inventories may be not so different semantically among themselves. Therefore, it might be a prolific idea to use some kind of classification trees methods to incorporate them (items and answers) directly in one analysis with the EEG bands, leads and levels of power and/or some other parameters.
Conclusions
Generally, we have to admit that STQ-150 has shown remarkable correspondence of our results to Rusalov’s initial findings. This finding advocates for the general plausibility and robustness of Inventory – EEG approach. At the same time, the differences between STQ-150 and STQ-77 are considerably big. STQ-77 and TCI-140 results are quite similar and at the same time different from Rusalov’s original TCI-150 regarding the slow waves. In order to find out in how far this is determined by the experimental setting further experimental studies are required. Nevertheless, it is quite obvious that slow waves spectral power especially that of the Theta band are the best of all at registering emotional states.
Funding: This work was supported by the Ministry of Education and Science RF, topic #0138-2024-0014
CRediT author statement:
The authors have read and approved the final version and bear responsibility for all aspects of the publication.
The authors declare no conflict of interest.
References
- Almaev, N.A., Murasheva, & O.V., Petrovich, D.L. (2020). EEG correlates of the personality questionnaires: Rusalov’s STQ-150, Trofimova’s STQ-77 and Cloninger’s TCI, Russian version. Psychophysiology news, 3, 135−138. [EEG korrelyaty` lichnostnyh oprosnikov: OFDSI Rusalova, OST-77 Trofimovoj i TTX-140 Klonindzhera//«Vestnik psixofiziologii» №3, 2020 ] http://psyphysjorn.ru/
- Almayev, N.A. & Ostrovskaya, L.D. (2005). Russian-language adaptation of temperament and character inventory by С. R. Cloninger. Psychological Journal, 26 (6), 77–86. [Almaev N. A., Ostrovskaya L. D., Psixometricheskie svojstva Oprosnika temperamenta I xaraktera R. Klonindzhera na russkoyazy`chnoj vy`borke // Psixologicheskij zhurnal. 2005]
- Cloninger C.R., Przybeck T.R., Svrakic, D.M., Wetzel, R.D. (1994). The Temperament and Character Inventory (TCI): a guide to its development and use.
- Koehler, S., Wacker, J., Odorfer, T., Reif, A., Gallinat, J., Fallgatter, A.J., Herrmann M.J., (2011). Resting posterior minus frontal EEG slow oscillations is associated with extraversion and DRD2 genotype. Biological Psychology, 87(3), 407–413.
- Knyazev, G.G. (2010). Antero-Posterior EEG Spectral Power Gradient as a Correlate of Extraversion and Behavioral Inhibition. Open Neuroimage Journal, Vol. 4, pp. 114–120.
- Laengle, A., Orgler, Ch., Kundi, M. Existez-Skala (2000). Beltz Test GmbH, Goettingen. http://hogrefe.de
- Majnina, I.N. & Vasanov, A.Yu. (2011). Standardization of Langle-Orgler existence scale. Psychological Journal, 31(1), 87-99. [Majnina I. N., Vasanov A. Yu. Standartizaciya metodiki “Shkala Ekzistencii” A. Lengle, K. Orgler // Psikhologicheskij zhurnal].
- Rusalov, V.M. & Trofimova, I.N. (2023). The Structure of Temperament and its Measurement. The Theory and the Manual of the Structure of Temperament Questionnaire (STQ), Second Edition (2023), Toronto.
- Vacker, J. & Gatt, J.M. (2010). Resting posterior versus frontal delta/theta EEG activity is associated with extraversion and the COMT VAL158MET polymorphism. Neuroscience Letters, 478(2), 88–92.
Comments (0)
In our studies of the psychophysiology of acoustic perception and musical preferences in 2018 and 2019, we used the temperament and character questionnaires: Rusalov’s STQ-150, Rusalov & Trofimova’s OST-77, and the Russian version of the Cloninger’s TCI. Current paper summarizes the found correlations between the scales of these questionnaires and the spectral power of the EEG in traditional bands, in various leads. It has to be admitted that in the current study STQ-150 has shown remarkable correspondence of the results to Rusalov’s initial findings (1979). On the other hand, STQ-77 and TCI-140 results are quite similar and at the same time different from Rusalov’s original STQ -150 regarding the slow waves. In order to find out in how far this is determined by the experimental settings further studies are required. Nevertheless, it is quite obvious that slow waves spectral power especially that of the Theta band are the best at registering emotional states.
In general, the results of the Inventories are in good agreement with each other and are well interpreted from the standpoint of the contemporary psychophysiology. Rusalov & Trofimova’s STQ-77 should be recognized as especially effective.
В наших исследованиях психофизиологии акустического восприятия и музыкальных предпочтений в 2018 и 2019 годах мы использовали опросники темперамента и характера: STQ-150 Русалова, STQ-77 Русалова и Трофимовой и русскую версию ТКИ Клонингера. В настоящей статье обобщены обнаруженные корреляции между шкалами этих опросников и спектральной мощностью ЭЭГ в традиционных диапазонах в различных отведениях. Надо признать, что в настоящем исследовании STQ-150 показал поразительное соответствие результатов первоначальным выводам В.М. Русалова (1979). С другой стороны, результаты STQ-77 и TCI-140 весьма схожи и в то же время отличаются от оригинального STQ-150 Русалова в отношении медленных волн. Чтобы выяснить, в какой степени это определяется условиями эксперимента, необходимы дальнейшие исследования. Тем не менее, совершенно очевидно, что спектральная мощность медленных волн, особенно тета-диапазона, лучше всего подходит для регистрации эмоциональных состояний.
В целом полученные результаты хорошо согласуются друг с другом и хорошо интерпретируются с позиций современной психофизиологии. Особенно эффективным следует признать STQ-77 Русалова и Трофимовой.
Ключевые слова: мощность ЭЭГ, акустические стимулы, темп, громкость, полосы ЭЭГ, отведения, личностные качества, темперамент, характер, опросники.
Although the results of this study were partially presented earlier in the conference paper in Russian (Almaev et al., 2020) and in the Manual of the Structure of Temperament Questionnaire (Rusalov & Trofimova, 2023), all of the related tables were never published and discussed before in their completeness.
From the general considerations, approach in which data of personality inventories are related to the EEG spectral power in resting state may seem not to be sufficiently robust. Nevertheless, their results are quite consistent and reasonably interpretable (Vacker & Gatt, 2010, Knyazev, 2010; Koehler et al., 2011).
Table 1. Summary of Correlations between EEG measurements and parameters of temperament
| Parameter of EEG | Parameter of temperament | Correlation,
p-level |
| Variability of evoked potential | Plasticity in probabilistic conditions | 0.67 ** |
| The energy of slow EEG rhythms | Ergonicity of physical activity | −0.38 * |
| Energy of slow EEG rhythms | Ergonicity of intellectual (probabilistic) activity | −0.68 ** |
| The energy of slow EEG rhythms | Speed of probabilistic activity | −0.43 ÷−0.59 * |
| The energy of slow EEG rhythms | Variability of the speed of probabilistic activity | −0.37 ÷ −0.57 * |
| Frequency of slow EEG rhythms | Variability of probabilistic activity | 0.46 ÷ 0.56 * |
| Frequency of slow EEG rhythms | Speed of activity | −0.62 ** |
| Activity of Beta-2 | Plasticity in probabilistic conditions | 0.55 ** |
| Activity of Beta-2 | Sensitivity to probability | 0.36 * |
| Spacio-temporal coherence of EEG | Plasticity in probabilistic conditions | −0.36 ÷ −0.53 ** |
| Spacio-temporal coherence of EEG | Speed of probabilistic activity | 0.68 ** |
Original Rusalov’s findings regarding EEG bands and temperamental traits registered in different experiments and by his first inventory STQ-150 are presented in Table 1. (Adopted by Rusalov & Trofimova, 2023). Trofimova’s innovations stem mostly from the neurochemical framework, they incorporate the findings of the last decades in the studies of neurotransmitters and hormones. This brings STQ-77 closer to Cloninger’s TCI-240 model (Cloninger et al., 1994) and our TCI-140 adaptation for the Russian sample (Almayev & Ostrovskaya, 2005), although they of course have some differences between them.
Table 2. Total number of correlations between power in traditional EEG ranges, two STQ versions, Extended (STQ-150) and Compact (STQ-77) and Cloninger’s TCI-140 (Almayev, et al, 2020)
| Item\Inventory | STQ-150 | STQ-77 | TCI-140 |
| Sample | N = 28 | N = 24 | N = 24 |
| Total N of correlations, p < 0.05 | 37 | 87 | 91 |
| Delta | 6 | 12 | 13 |
| Theta | 6 | 50 | 27 |
| Alpha | 7 | 2 | 4 |
| Beta 1 | 11 | 9 | 15 |
| Beta 2 | 7 | 3 | 14 |
| Gamma | 0 | 11 | 18 |
As it was found, the STQ-77 appeared to have more substantial differential power for EEG biomarkers in comparison to the STQ-150 and the TCI-140. The large number of significant correlations between the TCI scales and the EEG indices was mainly due to the correlations with the TCI validity scales or the TCI summing indices rather than correlations with the temperament or character scales of this test. In contrast, statistically significant correlations with the STQ-77 mainly showed up in temperament scales (Tab. 2).
We studied individual differences in the psychophysiology of perception of sound, music and musical preferences. Several methods were used, including EEG, the Extended STQ (STQ-150) (in 2018, 28 adult participants, M/F = 14/14) and the Compact STQ (STQ-77) (in 2019, 24 adult participants, M/F = 13/11, M age = 23.2, SD = 4.9). In the second study, was also used Cloninger’s Temperament and Character Inventory (TCI-140), Russian version, for comparison of the differential power of these methods.
The samples of the first and the second studies didn’t cross except 2−3 subjects. In both samples, EEG recording was conducted before testing with the STQ and experimental exposure to the sound stimuli. In the both cases the data under analyses was recorded with subjects eyes closed.
Mitsar 202-1 encephalograph was used, 21 electrodes mounted according to 10−20 system. Rejection of artifacts in the both studies was mainly automatic by Mitsar software with the following parameters identical in both cases: amplitude threshold 200 μv, slow wave amplitude threshold 100 μv. Slow waves frequency from 0 to 1 Hz. Fast waves amplitude threshold 100 μv, fast waves frequency from 25 to 30Hz, interval cleared before an artifact – 200 msec, after an artefact – 200 msec.
Nevertheless, one condition was substantially different in the experimental settings. In the first study (STQ-150) the stimuli were presented by the noise like sounds of the different intensity, while in the second one they were the favourite musical compositions of the participants, deliberately chosen by them in beforehand. This condition can be the possible influencing factor due to the expectations of the subjects. This difference has to be kept in mind especially regarding the differences in slow waves (Delta and Theta bands).
1.1. Delta band
The spectral power in the lower frontal areas generating this band (Fp1, Fp2, Fpz) had a significant negative correlation with the STQ-150 scales of Intellectual Tempo and Social Plasticity (Tab. 3).
Twelve scales of the STQ77 had significant positive correlations with this band: six correlations with the Satisfaction scale, two with the Empathy scale (T4, O2), one with the Social Endurance scale (T5), two with the Physical Tempo scale (F7, p = 0.007 and F4) and one with the Plasticity scale (F7) (Tab. 4).
Table 3. Correlations between Delta EEG band and the STQ-150 scales
| Delta EEG band & STQ-150 | Valid | Spearman r | t(N−2) | p-level |
| Intellectual Tempo & Fp1 | 28 | −0.44 | −2.48 | 0.02 |
| Social Plasticity & Fp2 | 28 | −0.39 | −2.16 | 0.04 |
| Intellectual Tempo & Fp2 | 28 | −0.43 | −2.42 | 0.02 |
| Control Scale & F7 | 28 | −0.39 | −2.14 | 0.04 |
| Social Plasticity & Fpz | 28 | −0.39 | −2.18 | 0.04 |
| Intellectual Tempo & Fpz | 28 | −0.48 | −2.81 | 0.01 |
Table 4. Correlations between Delta EEG band and the STQ-77 scales
| Delta EEG band & STQ-77 | Valid | Spearman r | t(N−2) | p-level |
| Physical Tempo & F7 | 24 | 0.537 | 2.984 | 0.007 |
| Physical Tempo & F4 | 24 | 0.458 | 2.420 | 0.024 |
| Social Endurance & T5 | 24 | 0.406 | 2.082 | 0.049 |
| Empathy & T4 | 24 | 0.435 | 2.263 | 0.034 |
| Empathy & O2 | 24 | 0.439 | 2.289 | 0.032 |
| Plasticity & F7 | 24 | 0.428 | 2.221 | 0.037 |
| Plasticity & T4 | 24 | 0.405 | 2.076 | 0.050 |
| Satisfaction & F3 | 24 | 0.437 | 2.276 | 0.033 |
| Satisfaction & T3 | 24 | 0.495 | 2.670 | 0.014 |
| Satisfaction & Cz | 24 | 0.429 | 2.228 | 0.036 |
| Satisfaction & P4 | 24 | 0.430 | 2.236 | 0.036 |
| Satisfaction & O1 | 24 | 0.434 | 2.259 | 0.034 |
| Satisfaction & Oz | 24 | 0.468 | 2.484 | 0.021 |
The STQ-150 had six significant correlations with this band, four of which were negative, with the Validity (social desirability) scale (Fp2, F7, F3, F8). This can be interpreted as also negative correlation of the slow waves with intellectual functions. (Tab 5). The STQ-150 scales of Intellectual and Emotional Plasticity both had positive correlation with O1. Correlations with O1 are apparently artifact caused by the «eyes closed» condition.
The STQ-77 has 50 statistically significant correlations with this band. Twenty-eight of them were with social scales: Social Endurance, Social Tempo and Empathy, and 12 with the Satisfaction scale (Tab. 6).
Table 5. Correlations between Theta EEG band and the STQ-150 scales
| Theta EEG band & STQ-150 | Valid | Spearman r | t(N−2) | p-level |
| Control Scale & Fp2 | 28 | −0.39 | −2.18 | 0.04 |
| Control Scale & F7 | 28 | −0.44 | −2.49 | 0.02 |
| Control Scale & F3 | 28 | −0.48 | −2.77 | 0.01 |
| Control Scale & F8 | 28 | −0.47 | −2.68 | 0.01 |
| Intellectual Plasticity & O1 | 28 | 0.38 | 2.1 | 0.05 |
| Social Plasticity & O1 | 28 | 0.38 | 2.11 | 0.04 |
Table 6. Correlations between Theta EEG band and the STQ-77 scales
| Theta EEG band &STQ-77 | Valid | Spearman r | t(N−2) | p-level |
| Physical Endurance & F7 | 24 | 0.547 | 3.062 | 0.006 |
| Physical Endurance & F3 | 24 | 0.423 | 2.187 | 0.040 |
| Physical Endurance & F4 | 24 | 0.492 | 2.648 | 0.015 |
| Physical Tempo & Fpz | 24 | 0.483 | 2.590 | 0.017 |
| Physical Tempo & Fp2 | 24 | 0.458 | 2.420 | 0.024 |
| Physical Tempo & F7 | 24 | 0.636 | 3.866 | 0.001 |
| Physical Tempo & F4 | 24 | 0.429 | 2.229 | 0.036 |
| Social Endurance & F3 | 24 | 0.457 | 2.409 | 0.025 |
| Social Endurance & Fz | 24 | 0.419 | 2.166 | 0.041 |
| Social Endurance & T3 | 24 | 0.469 | 2.491 | 0.021 |
| Social Endurance & C3 | 24 | 0.415 | 2.139 | 0.044 |
| Social Endurance & Cz | 24 | 0.409 | 2.101 | 0.047 |
| Social Endurance & C4 | 24 | 0.409 | 2.104 | 0.047 |
| Social Endurance & T5 | 24 | 0.488 | 2.625 | 0.015 |
| Social Endurance & P3 | 24 | 0.487 | 2.615 | 0.016 |
| Social Endurance & Pz | 24 | 0.463 | 2.447 | 0.023 |
| Social Endurance & P4 | 24 | 0.453 | 2.386 | 0.026 |
| Social Endurance & T6 | 24 | 0.408 | 2.098 | 0.048 |
| Social Endurance & O1 | 24 | 0.476 | 2.539 | 0.019 |
| Social Endurance & Oz | 24 | 0.461 | 2.438 | 0.023 |
| Social Tempo & Fpz | 24 | 0.416 | 2.147 | 0.043 |
| Social Tempo & F3 | 24 | 0.452 | 2.376 | 0.027 |
| Social Tempo & C4 | 24 | 0.407 | 2.087 | 0.049 |
| Social Tempo & P3 | 24 | 0.421 | 2.179 | 0.040 |
| Social Tempo & Pz | 24 | 0.458 | 2.420 | 0.024 |
| Social Tempo & P4 | 24 | 0.429 | 2.229 | 0.036 |
| Social Tempo & T6 | 24 | 0.465 | 2.467 | 0.022 |
| Social Tempo & O1 | 24 | 0.427 | 2.218 | 0.037 |
| Social Tempo & Oz | 24 | 0.408 | 2.098 | 0.048 |
| Empathy & T3 | 24 | 0.531 | 2.942 | 0.008 |
| Empathy & T5 | 24 | 0.494 | 2.668 | 0.014 |
| Empathy & P3 | 24 | 0.475 | 2.535 | 0.019 |
| Empathy & Pz | 24 | 0.486 | 2.609 | 0.016 |
| Empathy & O1 | 24 | 0.474 | 2.523 | 0.019 |
| Empathy & Oz | 24 | 0.499 | 2.703 | 0.013 |
| Plasticity & Fp1 | 24 | 0.457 | 2.412 | 0.025 |
| Plasticity & Fpz | 24 | 0.457 | 2.412 | 0.025 |
| Plasticity & Fp2 | 24 | 0.438 | 2.285 | 0.032 |
| Satisfaction & Fp1 | 24 | 0.437 | 2.278 | 0.033 |
| Satisfaction & Fpz | 24 | 0.614 | 3.649 | 0.001 |
| Satisfaction & Fp2 | 24 | 0.545 | 3.048 | 0.006 |
| Satisfaction & F7 | 24 | 0.496 | 2.676 | 0.014 |
| Satisfaction & F3 | 24 | 0.517 | 2.833 | 0.010 |
| Satisfaction & Fz | 24 | 0.538 | 2.996 | 0.007 |
| Satisfaction & F4 | 24 | 0.551 | 3.094 | 0.005 |
| Satisfaction & F8 | 24 | 0.499 | 2.701 | 0.013 |
| Satisfaction & T3 | 24 | 0.409 | 2.105 | 0.047 |
| Satisfaction & Cz | 24 | 0.416 | 2.143 | 0.043 |
| Satisfaction & C4 | 24 | 0.419 | 2.167 | 0.041 |
| Satisfaction & O2 | 24 | 0.433 | 2.250 | 0.035 |
Alpha band
This band has five positive statistically significant correlations in the central region with the STQ-150 scale of Intellectual Plasticity (in F4, T3, C3, Cz, C4), a positive significant correlation with the STQ-150 Intellectual Tempo (C4) and a negative significant correlation with the STQ-150 scale of Motor Emotionality (in Pz) (Table 7).
Regarding the STQ-77, this band has shown positive significant correlations with the scales of Social Endurance (T6) and Empathy (T3) (Table 9). Cloninger’s TCI has also only two correlations with Alpha band.
Table 7. Correlations between Alpha EEG band and the STQ-150 scales
| Alpha EEG band & STQ-150 | Valid | Spearman r | t(N−2) | p-level |
| Intellectual Plasticity & F4 | 28 | 0.41 | 2.3 | 0.03 |
| Intellectual Plasticity & T3 | 28 | 0.39 | 2.14 | 0.04 |
| Intellectual Plasticity & C3 | 28 | 0.47 | 2.69 | 0.01 |
| Intellectual Plasticity & Cz | 28 | 0.47 | 2.7 | 0.01 |
| Intellectual Plasticity & C4 | 28 | 0.46 | 2.63 | 0.01 |
| Intellectual Tempo & C4 | 28 | 0.41 | 2.27 | 0.03 |
| Motor Emotionality & Pz | 28 | −0.39 | −2.18 | 0.04 |
Table 8. Correlations between the STQ-150 scales and Alpha /(Beta 1+ Beta2) index
| Alpha / (Beta1+ Beta2) | Valid | Spearman r | t(N−2) | p-level |
| Intellectual Plasticity & T3 | 28 | 0.374 | 2.058 | 0.050 |
| Intellectual Plasticity & C3 | 28 | 0.449 | 2.564 | 0.016 |
| Intellectual Plasticity & T4 | 28 | 0.489 | 2.859 | 0.008 |
Table 9. Correlations between Alpha EEG band and the STQ-77 scales
| Alpha EEG band & STQ-77 | Valid | Spearman r | t(N−2) | p-level |
| Social Endurance & T6 | 24 | 0.429 | 2.230 | 0.036 |
| Empathy & T3 | 24 | 0.417 | 2.154 | 0.042 |
Beta 1 band
Originally (see Table 1) there was no information about Beta1 band. Correlations with occipital leads are also far from having obvious explanation (Table 10). Nine correlations with STQ77 scales found in this band, seven of them negative with sensation seeking (Table 11). There are two correlations between Beta1 EEG band and the STQ-77scales on the level of tendency (Table 12).
Table 10. Correlations between Beta-1 EEG band and the STQ-150 scales
| Beta 1 EEG band & STQ-150 | Valid | Spearman r | t(N−2) | p-level |
| Social Ergonicity & T6 | 28 | 0.38 | 2.11 | 0.04 |
| Motor Ergonicity & O1 | 28 | 0.39 | 2.18 | 0.04 |
| Social Ergonicity & O1 | 28 | 0.45 | 2.59 | 0.02 |
| Motor Plasticity & O1 | 28 | 0.4 | 2.2 | 0.04 |
| Intellectual Plasticity & O1 | 28 | 0.44 | 2.47 | 0.02 |
| Social Plasticity & O1 | 28 | 0.51 | 3 | 0.01 |
| Motor Tempo & O1 | 28 | 0.48 | 2.76 | 0.01 |
| Social Ergonicity & Oz | 28 | 0.51 | 3.05 | 0.01 |
| Motor Plasticity & Oz | 28 | 0.39 | 2.16 | 0.04 |
| Intellectual Plasticity & Oz | 28 | 0.37 | 2.05 | 0.05 |
| Social Plasticity & Oz | 28 | 0.48 | 2.79 | 0.01 |
Table 11. Correlations between Beta1 EEG band and the STQ-77 scales
| Beta 1 EEG band & STQ-77 | Valid | Spearman | t(N−2) | p-level |
| Sensation Seeking & Fp2 | 24 | −0.421 | −2.176 | 0.041 |
| Sensation Seeking & F7 | 24 | −0.420 | −2.170 | 0.041 |
| Sensation Seeking & F3 | 24 | −0.433 | −2.256 | 0.034 |
| Sensation Seeking & Fz | 24 | −0.415 | −2.137 | 0.044 |
| Sensation Seeking & F4 | 24 | −0.405 | −2.080 | 0.049 |
| Sensation Seeking & F8 | 24 | −0.434 | −2.256 | 0.034 |
| Sensation Seeking & T4 | 24 | −0.641 | −3.918 | 0.001 |
| Social Tempo & T6 | 24 | 0.439 | 2.291 | 0.032 |
| Empathy & T3 | 24 | 0.480 | 2.569 | 0.018 |
Table 12. Correlations between Beta1 EEG band and the STQ-77scales at the level of tendency
| Beta1 EEG band & STQ-77, tendency | Valid | Spearman r | t(N−2) | p-level |
| Sensation Seeking & Cz | 24 | −0.374 | −1.890 | 0.072 |
| Sensation Seeking & C4 | 24 | −0.402 | −2.061 | 0.051 |
Beta 2 band
Seven significant correlations were found between this band and the STQ-150 scales. Four of them are negative with emotionality (Table 13). No significant correlations were found between Gamma EEG band and the scales of STQ-150 (Table 14).
Table 13. Correlations between Beta2 EEG band and the STQ-150 scales
| Beta 2 EEG band & STQ-150 | Valid | Spearman r | t(N−2) | p-level |
| Social Emotionality & Fpz | 28 | −0.41 | −2.29 | 0.03 |
| Social Emotionality & F3 | 28 | −0.48 | −2.81 | 0.01 |
| Intellectual Emotionality & F4 | 28 | −0.39 | −2.13 | 0.04 |
| Social Emotionality & F4 | 28 | −0.42 | −2.36 | 0.03 |
| Intellectual Plasticity & O1 | 28 | 0.4 | 2.21 | 0.04 |
| Social Plasticity & O1 | 28 | 0.43 | 2.4 | 0.02 |
| Social Plasticity & O2 | 15 | 0.54 | 2.32 | 0.04 |
Table 14. Correlations between Beta2 EEG band and the STQ-77 scales
| Beta 2 EEG band & STQ-77 | Valid | Spearman r | t(N−2) | p-level |
| Sensation Seeking & T3 | 24 | −0.416 | −2.145 | 0.043 |
| Sensation Seeking & T4 | 24 | −0.414 | −2.132 | 0.044 |
| Empathy & F7 | 24 | 0.442 | 2.312 | 0.031 |
| Empathy & F3 (tendency) | 24 | 0.397 | 2.027 | 0.055 |
Gamma band had 11 significant correlations with the STQ-77 scales. Out of these, seven positive correlations were with the scale of Probabilistic Processing (F7, Fz; p = 0.004, C3, Cz, P3, Pz; p = 0.009, T6) (Table 15).
Table 15. Correlations between Gamma EEG band and the STQ-77 scales
| Gamma EEG band & STQ-77 | Valid | Spearman r | t(N−2) | p-level |
| Sensation Seeking & Fpz | 24 | −0.408 | −2.096 | 0.048 |
| Social Endurance & F8 | 24 | −0.415 | −2.139 | 0.044 |
| Empathy & F7 | 24 | 0.481 | 2.572 | 0.017 |
| Empathy & Fz | 24 | 0.408 | 2.094 | 0.048 |
| Probabilistic processing & F7 | 24 | 0.465 | 2.464 | 0.022 |
| Probabilistic processing & Fz | 24 | 0.560 | 3.167 | 0.004 |
| Probabilistic processing & C3 | 24 | 0.446 | 2.334 | 0.029 |
| Probabilistic processing & Cz | 24 | 0.431 | 2.238 | 0.036 |
| Probabilistic processing & P3 | 24 | 0.506 | 2.755 | 0.012 |
| Probabilistic processing & Pz | 24 | 0.523 | 2.879 | 0.009 |
| Probabilistic processing & T6 | 24 | 0.481 | 2.571 | 0.017 |
1.1. Delta band
As we can see regarding Delta band there is exact correspondence between Rusalov’s original findings (Tab. 1) and our ones (Table 3). Slowest waves correlate negatively with the intellectual scales, especially in the frontal leads. Twelve scales of the STQ77 had significant positive correlations with this band: six correlations with the Satisfaction scale, two with the Empathy scale (T4, O2), one with the Social Endurance scale (T5), two with the Physical Tempo scale (F7, p = 0.007 and F4) and one with the Plasticity scale (F7) (Table 4). At least the results of the “Satisfaction” scale are susceptible in regards to the experimental settings influence. TCI-140 had 13 correlations mostly positive with Responsibility and Harmonic second nature (good habits).
1.2. Theta band
Four of STQ-150 significant negative correlations, with the Validity (social desirability) scale can be interpreted also as the negative association of the slow waves with intellectual functions. (Table 5). The STQ-150 scales of Intellectual and Emotional Plasticity both had positive correlation with O1. Correlations with O1 are apparently artifact caused by the “eyes closed” condition.
Regarding the STQ-77 we suggest that the positive association of this band with the Satisfaction scale probably reflects this study’s overall positive emotional background. The Theta band also had three positive correlations with the STQ-77 Plasticity (Fp1, Fpz, Fp2), three positive correlations with the STQ-77 Physical Endurance (F7, p = 0.006; F3, F4) and four positive correlations with the STQ-77 Physical Tempo scale (F7, p = 0.001; Fpz, Fp2, F4). The TCI-140 results are close to that of the STQ -77: 9 correlation of Theta band with Sentimentality (Reward-Dependence Scale #1) and 11 with Hypertrophied empathy (Self-Transcendence scale #2) – all positive.
1.3. Alpha band
This band has five positive statistically significant correlations in the central region with the STQ-150 scale of Intellectual Plasticity (in F4, T3, C3, Cz, C4), a positive significant correlation with the STQ-150 Intellectual Tempo (C4) and a negative significant correlation with the with STQ-150 scale of Motor Emotionality (in Pz). The last correlation permits to think that the plasticity here is a positive trend that permits deliberately switch from one activity to another. On the other hand well-known index Alpha /(Beta1+ Beta2) which widely accepted as staying for distraction vs. concentration, correlates with Intellectual Plasticity positively thus advocating for the prevailing distraction (see Tab. 8).
1.4. Beta1 band
The STQ-150 showed 11 statistically significant correlations with the spectral power in this range. All three types of Ergonicity and all three types of Plasticity of the STQ-150 had positive correlations with the O1, O2, and one at T6. Motor Tempo also positively correlated with the O2 (Tab. 10). Probably, it has to be taken into consideration that activity was registered during eyes closed. Observed correlation may be due to the well-known rise of activity in the occipital-parietal area in this condition. The STQ-77 has nine positive significant correlations with the spectral power in the Beta1 range. Seven of these correlations were negative associations between the Sensation Seeking scale and Fp2, F7, F3, Fz, F4, F8, and T4. This can be interpreted as the inhibitory function of the prefrontal cortex. There were also significant positive correlations between this band and the STQ-77 scales of Social Tempo (T6) and Empathy (T3). There are also two correlations at the level of tendency (tab. 12). According to our understanding these correlations show gradually weakening spread of inhibitory activity up to the central leads. Cloninger’s TCI revealed 12 correlations all of them positive and with Reward dependence scales.
1.5. Beta2 band
According to Rusalov’s theory Emotionality means rise of entropy and generally decay and malfunction of the corresponding activities. Therefore, negative correlations with different types of emotionality in the frontal leads mean effectiveness of corresponding activities (tab.12). Thus, obtained results match Rusalov’s initial findings regarding Beta 2 band (see tab.13). Previously (Almayev, et al., 2020) we’ve pointed out the opposite impact of Emotionality and Plasticity on this band. Normally, the plasticity of behavior involves the suppression of emotional impulses by the higher activity of the prefrontal cortex. When these impulses are not sufficient in cases of weak prefrontal control, the plasticity of behavior turns into distraction. Correlations of Beta-2 with STQ-77 continues the line of correlation with Beta 1 on the inhibitory activity of prefrontal cortex being spread on the lateral central leads. Empathy is detected as the fast wave activity according to it. The results of the Cloninger’s TCI are in the correspondence with these findings: there are 6 negative correlations with Impulsivity and Extravagancy all in the frontal leads, and 2 positive correlations with Sentimentality (O2).
1.6. Gamma band
We suggest that the Probabilistic Processing scale of the STQ-77 adequately reflects the gamma-spectrum of brain electric activity (tab. 15). It also has to be noted that this activity was primarily registered from the left hemisphere of the scale without any signs of frontal-occipital opposition. There were also two significant positive correlations between the Empathy scale and F7, Fz, and a negative correlation between the Sensation-seeking scale and Fpz, as well as between the Social Endurance scale and F8. In the case of Sensation-seeking Gamma activity can be interpreted the same way as in the case of Beta 1 and Beta 2 as the inhibitory one, produced by the Prefrontal cortex. Cloninger’s TCI had totally 18 correlations with Gamma band, In the TTX-140 test there is no self-assessment scale similar to “Intelligence” in OST-77, but it is all the more interesting that its close functional analogue turned out to be the “Agreement/ Negativism” control scale, which negatively correlates with the power of the Gamma range in seven leads Fpz, F8, Fz, F7, C3 , T3, T4. The lower the Gamma band power value in these leads, the higher is the tendency to answer “yes” to questions in the test. That is, an increase in activity in the Gamma range in these leads can be interpreted as increased vigilance. Another three of them correlate negatively with Extravagancy in frontal leads and Cz, thus behaving the same way as in the case of Beta 2 band.
1.7. Existenz Skale
As it is mentioned in (Almayev et al., 2020) we have also used Existenz Skale by Laengle et al. (2020) in the Russian adaptation by Mainina and Vasanov (2011). It is rather specific questionnaire of 46 items and four subscales that doesn’t correspond to the structure of a personality inventory. Nevertheless, the general situation with its’ results (p<0.05) and the EEG bands is the same as for the inventories described above: Delta – 41 correlations, Theta – 60 correlations (more than in STQ-77), Alpha – 3 correlations, Beta 1 – none, Beta 2 – 5, Gamma – none.
Items of the scales from different inventories may be not so different semantically among themselves. Therefore, it might be a prolific idea to use some kind of classification trees methods to incorporate them (items and answers) directly in one analysis with the EEG bands, leads and levels of power and/or some other parameters.
Generally, we have to admit that STQ-150 has shown remarkable correspondence of our results to Rusalov’s initial findings. This finding advocates for the general plausibility and robustness of Inventory – EEG approach. At the same time, the differences between STQ-150 and STQ-77 are considerably big. STQ-77 and TCI-140 results are quite similar and at the same time different from Rusalov’s original TCI-150 regarding the slow waves. In order to find out in how far this is determined by the experimental setting further experimental studies are required. Nevertheless, it is quite obvious that slow waves spectral power especially that of the Theta band are the best of all at registering emotional states.
Funding: This work was supported by the Ministry of Education and Science RF, topic #0138-2024-0014
CRediT author statement:
The authors have read and approved the final version and bear responsibility for all aspects of the publication.
The authors declare no conflict of interest.
- Almaev, N.A., Murasheva, & O.V., Petrovich, D.L. (2020). EEG correlates of the personality questionnaires: Rusalov’s STQ-150, Trofimova’s STQ-77 and Cloninger’s TCI, Russian version. Psychophysiology news, 3, 135−138. [EEG korrelyaty` lichnostnyh oprosnikov: OFDSI Rusalova, OST-77 Trofimovoj i TTX-140 Klonindzhera//«Vestnik psixofiziologii» №3, 2020 ] http://psyphysjorn.ru/
- Almayev, N.A. & Ostrovskaya, L.D. (2005). Russian-language adaptation of temperament and character inventory by С. R. Cloninger. Psychological Journal, 26 (6), 77–86. [Almaev N. A., Ostrovskaya L. D., Psixometricheskie svojstva Oprosnika temperamenta I xaraktera R. Klonindzhera na russkoyazy`chnoj vy`borke // Psixologicheskij zhurnal. 2005]
- Cloninger C.R., Przybeck T.R., Svrakic, D.M., Wetzel, R.D. (1994). The Temperament and Character Inventory (TCI): a guide to its development and use.
- Koehler, S., Wacker, J., Odorfer, T., Reif, A., Gallinat, J., Fallgatter, A.J., Herrmann M.J., (2011). Resting posterior minus frontal EEG slow oscillations is associated with extraversion and DRD2 genotype. Biological Psychology, 87(3), 407–413.
- Knyazev, G.G. (2010). Antero-Posterior EEG Spectral Power Gradient as a Correlate of Extraversion and Behavioral Inhibition. Open Neuroimage Journal, Vol. 4, pp. 114–120.
- Laengle, A., Orgler, Ch., Kundi, M. Existez-Skala (2000). Beltz Test GmbH, Goettingen. http://hogrefe.de
- Majnina, I.N. & Vasanov, A.Yu. (2011). Standardization of Langle-Orgler existence scale. Psychological Journal, 31(1), 87-99. [Majnina I. N., Vasanov A. Yu. Standartizaciya metodiki “Shkala Ekzistencii” A. Lengle, K. Orgler // Psikhologicheskij zhurnal].
- Rusalov, V.M. & Trofimova, I.N. (2023). The Structure of Temperament and its Measurement. The Theory and the Manual of the Structure of Temperament Questionnaire (STQ), Second Edition (2023), Toronto.
- Vacker, J. & Gatt, J.M. (2010). Resting posterior versus frontal delta/theta EEG activity is associated with extraversion and the COMT VAL158MET polymorphism. Neuroscience Letters, 478(2), 88–92.
Introduction