Manifestations of the Dynamism of the Nervous System in some Electroencephalographic Parameters
Abstract
Abstract

Vladimir Nebylitsyn (July 21, 1930 – October 1, 1972) was a member of the Academy of Pedagogical Sciences of the USSR. He was one of those who were at the origins of the creation of the Institute of Psychology of the USSR (named like the Institute of Psychology of the Russian Academy of Sciences now), whose efforts made this major step in the development of psychological science in Russia, associated with its promotion in the field of recognition by the scientific community.
In his work, V. Nebylitsyn was associated with many scientific institutions: The Psychological Institute of the Russian Academy of Sciences, the Institute of Psychology of the Russian Academy of Sciences, the Faculty of Psychology of Moscow University, many institutes in Moscow, Leningrad, Tbilisi, and other cities of the country. He was vice-president of the All-Union Society of Psychologists, deputy chairman, member of the editorial board and deputy executive editor of several major scientific journals.
He played a particularly important role in the fate of the Institute of Psychology of the Russian Academy of Sciences. The very fact of the Institute’s existence is inextricably linked with the name of Vladimir Nebylitsyn. Together with Boris Lomov, the first director of the Institute of Psychology of the Russian Academy of Sciences, Vladimir Nebylitsyn carried out the work of the young institution, determined its spirit, selected employees, invested directly in the arrangement of the institute premises.
From the first days of the foundation of the Institute of Psychology of the USSR Academy of Sciences (1971), he was deputy director and head of the Laboratory of Differential Psychology. V. Nebylitsyn believed that differential psychophysiology is the most productive of all the biological theories of personality development proposed so far. Its obvious advantages stem from the fact that it takes as a starting point not the secondary or secondary signs of biological organization, such as, for example, morphological indicators (signs of the bodily constitution in the theories of Kretschmer or Sheldon), but the signs of the central nervous system. The advantages of neurophysiological factors of individual psychological differences are confirmed by the whole course of the development of ideas and. Pavlov researchers working in the field of studying the basic properties of the nervous system, both in the field of purely physiological study of them, and in the field of research of their psychological manifestations and correlates (Nebylitsyn, 1971).
On the basis of B. Teplov’s research, V.D. Nebylitsyn developed the basic principles of differential psychophysiology. He proved Teplov’s hypothesis about the inverse relationship between the strength of the nervous system and sensitivity. He described the properties of the nervous system developed by Teplov (mobility, lability). Introduced a new term – dynamism. He has developed a number of electrophysiological methods for studying the dynamics of nervous processes occurring in the brain. He hypothesized about the general properties of the nervous system that underlie such personal characteristics as activity and self-regulation. One of the pioneers of the use of factor analysis in Soviet psychology.
V.D. Nebylitsyn identified three leading components in temperament related to the spheres of the individual’s general activity, his/her motor skills and his/her emotionality. Each of these components, in turn, has a very complex multidimensional structure and different forms of psychological manifestations.
The first component in the structure of temperament is the general mental activity of the individual. The essence of this component lies in the tendency of the individual to self-expression, effective development and transformation of external reality. According to the author, the degrees of activity are distributed from lethargy, inertia, passive contemplation at one pole to the highest degrees of energy, powerful impetuosity of actions and constant ascent at the other.
The second component of temperament is motor, in which the leading role is played by qualities related to the function of the locomotion (and primarily speech-motor) apparatus. V.Nebylitsyn attached special importance to motor skills as a means by which the internal dynamics of mental states with all its individual gradations is actualized. Among the dynamic qualities of the motor component are: speed, strength, sharpness, rhythm, amplitude and a number of other signs of muscle movement (some of them characterize speech motor skills).
The third component of temperament is emotionality, which is an extensive complex of properties and qualities that characterize the peculiarities of the emergence, flow and termination of various feelings, affects and moods. This component is the most complex and has its own branched structure. The main characteristics of emotionality are impressionability, impulsivity and emotional lability. Impressionability expresses the affective susceptibility of the subject, his sensitivity to emotional influences, his ability to find the ground for an emotional reaction where there is no such ground for others. Impulsivity is the speed with which emotion becomes the motivating force of actions and actions without their prior consideration and conscious decision to carry them out. Emotional lability refers to the rate at which a given emotional state ceases or one experience is replaced by another.
V.D. Nebylitsyn is the author of more than 80 scientific publications. The most breakthrough studies are presented in the monographs “Basic properties of the human nervous system” (1966) and “Psychophysiological studies of individual differences” (1976).
References
- Brushlinsky, A.V. & Ushakova, T.N. (1996). V.D. Nebylitsyn: life and scientific work”, M. Ladomir [Brushlinskiy A.V., Ushakova T.N. (1996). V.D. Nebylitsyn: zhizn’ i nauchnaya deyatel’nost’», M. Ladomir].
- Nebylitsyn, V.D. (1971). Actual problems of differential psychophysiology. Voprosy Psychologii, 6, 13-14, 19-25 [Nebylitsyn V.D. (1971). Aktual’nyye problemy differentsial’noy psikhofiziologii. Voprosy psikhologii, 6, 13-14, 19-25].
Manifestations of the Dynamism of the Nervous System in some Electroencephalographic Parameters
In: Nebylitsyn, V.D. Manifestations of the Dynamism of the Nervous System in some Electroencephalographic Parameters. In V. D. Nebylitsyn (1966). Basic properties of the nervous system, Moscow, p. 110-131.
Abstract: As is well known, electroencephalography provides the researcher with a number of convenient indicators of the basic properties of the nervous system, and in particular the dynamism of nervous processes based on the study of the phenomenon of activation, in other words blockade, suppression of the dominant rhythm. The only, but, unfortunately, important restriction of this method, which prevents its widespread use for the study of individual characteristics, is the lack of a sufficiently clear pronounced alpha-rhythm in some normal adult individuals (about 15-20%) and, consequently, the impossibility of applying to them methods based on determining the parameters of indicative and conditionally reflex activation. This important restriction to the widespread use of the EEG method can be overcome if such electroencephalographic indicators are found that are not reduced to the parameters of the activation reaction and themselves reflect certain properties of the nervous system. This paper includes some preliminary results to solve this problem. We will consider two issues here. One of them concerns the relationship between the dynamism of nervous processes and indicators of rest EEG or background indicators of EEG, and the other – the correlation between the dynamism of nervous processes and indicators of one of the frequently used “functional loads”, namely, the reaction of imposing the rhythm of a flashing light stimulus.
Introduction
Background EEG indicators and dynamism of nervous processes
The electroencephalogram differs from other recordable bioelectric or vegetative functions of a living organism in that it can be assumed to carry a huge amount of meaningful psychophysiological information, which is encrypted in the form of a continuous sequence of vibrations with a rather complex configuration. The task of decoding this information, i.e. establishing possible correlations between certain characteristics of the electrical activity of the brain, on the one hand, and some psychological or physiological parameters of the individual, on the other hand, has long attracted the attention of researchers.
At the same time, it should be borne in mind that the breadth of studying these background indicators is directly dependent on the arsenal of technical means of EEG analysis that the researcher has. In the presence of only one recording device, only a visual assessment of the electroencephalogram is possible, mainly according to the parameters of the dominant rhythm, and obtaining some of the simplest numerical values. Therefore, in the early works of electrophysiologists, mainly indicators related to the alpha-rhythm are analyzed: index, frequency and amplitude, and only recently, with the development of automatic analyzing technology, similar characteristics of other rhythms have been seriously studied, as well as a number of indicators based on mathematical processing of a continuous wave process, which in essence and is an EEG.
It was found that background EEG indicators are characterized by significant stability and for each given individual they form a unity that changes little over time (Loomis et al., 1936; Livanov, 1940; Shpilberg, 1940). At the same time, the general pattern of the EEG curve and the characteristics of individual parameters of the bioelectric activity of the brain varies very significantly from one individual to another, thereby suggesting that the elements that make up the electroencephalogram are in a certain dependence on some deep and stable qualities of individuality, first of all, obviously, of a psychophysiological nature.
This reason was guided by many authors who investigated the features of the main rhythms of the electroencephalogram in the aspect of personality characteristics (Lindsley, 1952; Ellingson, 1956; Gastaut, 1954; Were, 1957).
Although not all such attempts have resulted in the establishment of certain positive correlations, nevertheless, observations, guesses and assumptions of various authors have given us reason to think that, if not all, then at least some EEG parameters may be in some connection with the most stable personality traits – the main properties of the nervous system that form the basis of a number of human psychological personal characteristics. Some competent authors directly point to this possibility. So, N.V. Golikov said: “A special classification of the types of electrical activity should be associated with the characteristics of the types of higher nervous activity” (Golikov, 1956, p. 11). Indirect data in favor of such an assumption can be systematized as follows.
Based on the fact that concentration of attention and emotional arousal cause blockade of the alpha-rhythm, some authors have investigated the question of a possible relationship between the alpha-index and the tendency of subjects to a neurotic state of “anxiety”, that is increased emotional tension with the fixation of the subject on various negative, in his opinion, circumstances and factors.
The data turned out to be very contradictory. If M. Brazier (Brazier et al., 1945) assumed that EEG without alpha-rhythm reflect a tendency to anxiety, then A. Dondero (Dondero et al., 1956) indicates the absence of a significant correlation between the alpha-index and anxiety. L. Johnson and G. Ulett (Johnson & Ulett, 1959) found that the amount of alpha-activity reveals a connection with anxiety, but only when measured in the first experiment, when this activity turns out to be markedly reduced in people prone to anxiety. After the subject gets used to the situation, the connection of these two indicators is no longer observed. A curious dependence was observed by F. Beckman and M. Stein (Beckman & Stein, 1961), who obtained a significant negative correlation between the success of solving logical problems and the alpha-index on 33 subjects; they suggest that people who solve problems better and individuals with a low alpha-index have the same common feature: a higher level of cortical arousal.
The amplitude of the alpha-rhythm can in point of view be considered as an indicator similar to the alpha-index: states of attention and tension lead to a decrease in the amplitude of the alpha-rhythm in the same way as the alpha-index. With respect to the amplitude, therefore, the same assumptions are possible as with respect to the alpha-index. Indeed, Н. Gastaut and co-authors (Gastaut et al., 1951) characterize individuals with a high–voltage alpha-rhythm as “slow, calm, balanced”, and with a low-voltage one – as hypersensitive, hyperemotional, hyperactive. L. Saul and co-authors (Saul et al., 1949) associate a high amplitude with passivity and a tendency to avoid responsibility and effort, and a low amplitude with opposite qualities. A. Mundy-Castle (Mundy-Castle, 1957) notes “slowness, caution, balance” in individuals with a high amplitude of alpha-rhythm and inverse qualities in persons with a low-voltage alpha-rhythm. J. De Lange and co-authors (De Lange et al., 1962) found that subjects with an increased amplitude of alpha-rhythm and a high alpha-index were psychologically characterized by activity, self-confidence and lack of tension or anxiety, in general – stability, and subjects with low amplitude and alpha-rhythm index – opposite qualities: tension, anxiety, insufficient adequacy of behavior.
The least variable EEG indicator – the frequency of the alpha-rhythm – reveals, apparently, the least connection with the psychophysiological qualities of the individual. However, some authors (Brazier et al., 1945) found on a large material that the frequency of the alpha-rhythm in people with symptoms of anxiety is on average slightly higher than in normal people (11.2 and 10.6 Hz, respectively), and A. Mundy-Castle (Mundy-Castle, 1957) believes that persons with a relatively higher frequency of alpha-rhythm (more than 10 Hz) have a tendency to a sharp, impulsive, unstable reaction, while persons with a lower frequency – to a more depressive behavior, but the dependencies they found are still not enough a certain character.
All three of these indicators related to the alpha-rhythm reveal, based by some literature data, a certain relationship between them. So, A. Roget (Roget, 1960) notes that all indicators related to the alpha-rhythm are interconnected, although not very closely. We also point to the systematization of Н. Gastaut (Gastaut, 1954), who classified the results of a number of authors and his own and came to the conclusion that it is possible to distinguish the main types (syndromes) of electrographic recording, within each of which the alpha-index, the frequency of the alpha-rhythm and amplitude are in a certain correspondence, as well as the features of the distribution of more frequent activity, imposing rhythm and reaction to hyperventilation. In particular, hyperexcitability syndrome is characterized by the presence of periods of desynchronization (hence, a reduced alpha-index), a high frequency (11-13 Hz) of alpha-rhythm, its small amplitude, and hypovexcitability syndrome is characterized by a high amplitude, continuous, without desynchronization intervals alpha-rhythm-frequency of 8-9 Hz. Of course, this classification reflects only the main trends, which the author himself notes, but the direction of these trends deserves attention.
It can be considered very likely that the psychological qualities mentioned by the listed authors in connection with certain features of alpha-activity reflect some properties of the nervous system, it is only necessary to establish which ones. The analysis shows that the closest thing to these qualities is this property of the nervous system, which is usually designated as a balance of nervous processes and which, apparently, should be considered as a balance of nervous processes in terms of dynamism. Then, in general, a low-amplitude, high–frequency alpha-rhythm with frequent periods of desynchronization should correspond to high dynamism of excitation, and a high-amplitude, low-frequency alpha-rhythm recorded continuously should correspond to high dynamism of braking. This proposal was tested by us in comparison of the three indicated parameters of the alpha-rhythm with a number of indicators of indicative and conditionally indicative activation.
1.1 Correlation among resting EEG indicators and electrocortical balance indicators of nervous processes
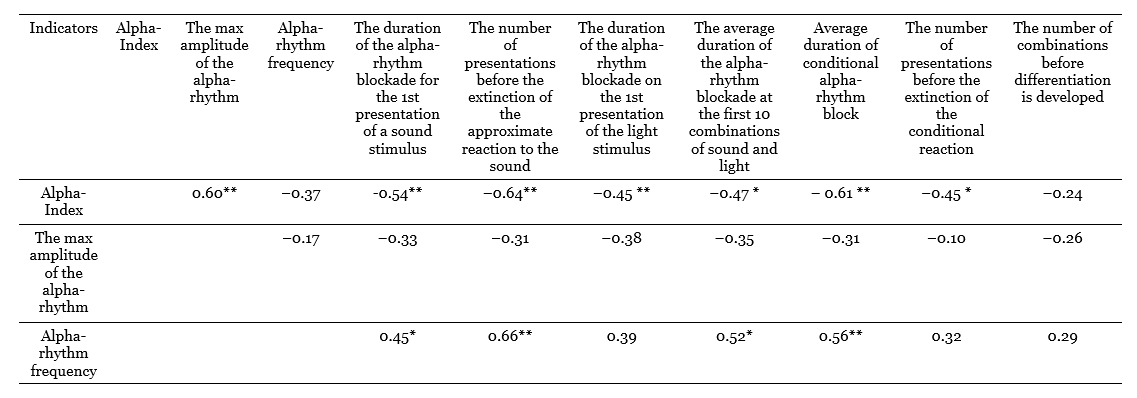
The results of this comparison in the form of grade correlation coefficients are given in Table 1, which is an extraction from the intercorrelation matrix of all the indicators studied in this table (Nebylitsyn, 1963 b, 1961 c). In this table, attention is drawn to the high correlation between the alpha-index and the amplitude of alpha-waves (note that the maximum amplitude was measured, and not the average, as usual), equal to +0.60 (p < 0.01); some connection also exists between the alpha-index and the frequency of the alpha-rhythm (p = 0.37; p> 0.05), and the correlation between amplitude and frequency is close to zero.
When comparing these background indicators with activation response indicators, it turns out that the alpha-index has quite high correlations with many of these indicators and that correlations of the alpha-rhythm frequency are also significant in some cases; as for the alpha-rhythm amplitude, although all its correlation coefficients with activation indicators are negative, which indicates despite a certain trend, none of them is statistically significant. During factorial processing, both activation indicators and background indicators entered into the same factor, which we can now define as the balance of nervous processes by dynamism. Thus, there are grounds to assume that, if not all, then some indicators of EEG alpha-activity are associated with the dynamism of nervous processes, determined using electroencephalographic techniques.
This conclusion was tested in the second series of electroencephalographic experiments conducted on approximately the same number of subjects; the only difference between the series was that instead of the amplitude of the alpha-rhythm, another indicator was taken for comparison in the second series, namely the total energy of the alpha-rhythm, measured using an electronic integrator (Nebylitsyn, 1965 a).
1.2. Correlation among indicators of the dynamism of nervous processes and the EEG background
The results turned out to be partially different from those obtained in the first series (Table 2). If the alpha-index still gave fairly high correlations with dynamism indicators, then the frequency of the alpha-rhythm this time found no connection with any of these indicators. As for the total energy of the alpha-range, this indicator, which is a function of the amplitude and the alpha-rhythm index, correlates with the dynamism indicators at about the same level (or slightly higher) as the amplitude (Table 1 and 2); in this case, the direction of correlation coincides with that which is characteristic of the alpha-index.
So, two separately conducted studies have shown a generally satisfactory coincidence of the results in the part that concerns the relationship between alpha-rhythm indicators and indicators of the dynamism of nervous processes. The only exception is the frequency of the alpha-rhythm, the correlations of which in the first series were quite high, and in
the second they fluctuate around zero. However, the influence of the dynamism of nervous processes on the frequency of the alpha-rhythm still exists. It can be opened with the help of another method of statistical tests, for the success of which the presence of “graduated and proportionate” relations between the studied parameters is not necessary (Gurevich, 1965 a). We are talking about assessing the significance of the differences between the average values of the two extreme groups of subjects selected based on the results of determining the dynamism of excitation or inhibition in them. The use of this method made it possible to show that in this sample, the dependence of the alpha-rhythm frequency, as well as other indicators of the EEG background, on dynamism exists and even has a rather significant character.
Table 1. Grade correlation coefficients between resting EEG indicators and electrocortical balance indicators of nervous processes (Nebylitsyn, 1963 b)
Note: *р < 0.05; **р < 0.01.
Table 2. Correlation coefficients between indicators of the dynamism of nervous processes and the EEG background
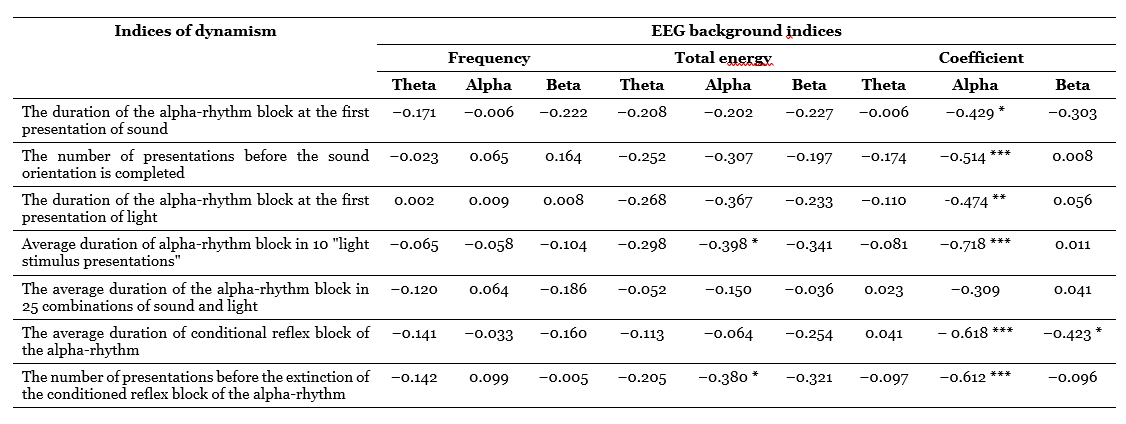
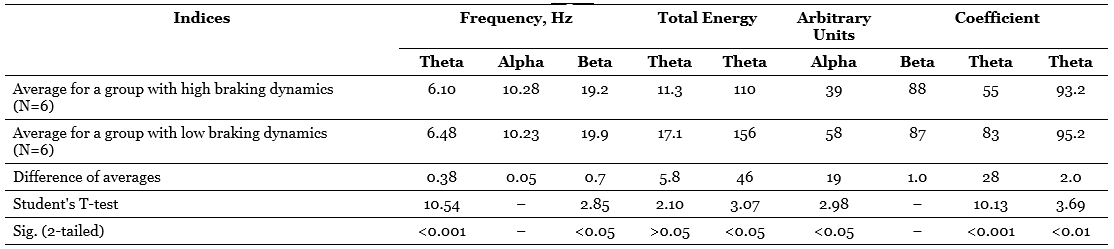
Table 3. Statistical evaluation of differences between the average EEG background values for groups with high and low dynamism of the inhibitory process
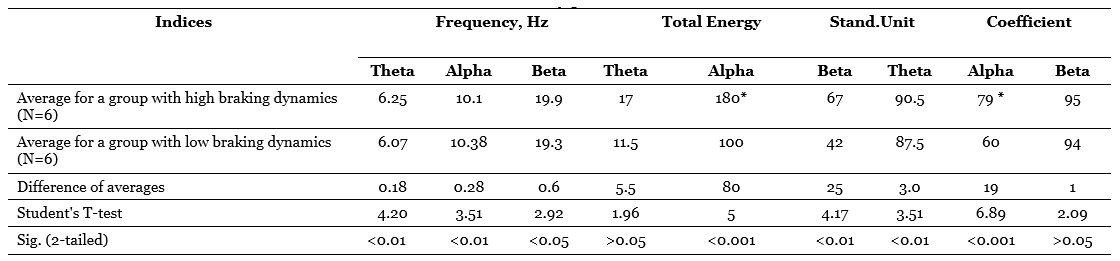
Table 4. Statistical evaluation of differences between the average EEG background values for groups with high and low dynamics of the excitatory process

1.3. Differences between the average EEG background values for groups with high and low dynamism of the inhibitory process
Table 3 presents the values of averages, their differences, criteria t and probabilities of the null hypothesis tested relative to the compared averages. This table compares the groups formed on the basis of one of the main indicators of the dynamism of the braking process – the rate of extinction of the conditional reaction. It can be seen that the difference between the averages of the total energy of the alpha-band and the alpha-index is very significant and that the difference in the frequency of the alpha-rhythm is also quite significant, although at first glance the difference in the averages is too small here. At the same time, persons with high dynamic inhibition (with rapid extinction of the conditioned reaction) have, on average, a lower frequency of the alpha-rhythm and higher values of the alpha-rhythm and the total energy of the alpha-stripe, which is a function of the index and amplitude of the alpha-rhythm. It is curious that if the same comparison is carried out for groups that differ in the dynamism of the excitatory process (by the average duration of the conditioned reflex activation reaction), the differences turn out to be much less distinct in two out of three cases (Table 4), namely, the difference in the frequency of the alpha-rhythm practically disappears, although the difference in total energy remains significant, but only at the 5%-level, and only the difference in the average values of the alpha-index increases even more.
So, the use of a statistical criterion that is in some sense more sensitive than the correlation coefficient allows us to confirm the conclusions regarding the dependence of the indicators related to the alpha-rhythm of the EEG on the dynamism of nervous processes and, moreover, to clarify these conclusions by indicating that a more significant role in the variations in the frequency and energy of the alpha-rhythm apparently, the dynamism of the braking process plays a role, while the alpha-index, apparently, equally depends on the dynamism of braking and on the dynamism of excitation.
As already mentioned, in the second series of our electroencephalographic experiments, an electronic analyzer was used (Kozhevnikov, 1954), which allowed, in addition to the alpha-rhythm, to isolate frequency bands belonging to beta- (14-25 Hz) and theta- (4-7 Hz) rhythms from the initial EEG. Therefore, we had the opportunity to compare with the indicators of the dynamism of nervous processes some characteristics of these two physiological rhythms, namely frequency, total energy for 10 second time intervals and index.
The literature data on beta-rhythm generally agree that increased beta-activity is one of the signs of increased emotionality, excitability, activity, etc. (Bogachenko, 1960; Mangan & Adcock, 1962; МсАdаm & Orme, 1954; Nelson, 1960; Werre, 1957), it could be assumed that high values of indicators related to the beta-band may be associated with high values of the dynamism of the excitatory process.
Correlation analysis shows that these assumptions are generally not justified (Table 2): the frequency of the beta-rhythm (in this band) does not correlate with the indicators of the dynamism of excitation, the total energy of the beta-band, like the total energy in the alpha-rhythm range, has negative correlations with these indicators, but far from significant; and only the beta-index, completely uncorrelated with the indicators of dynamism of inhibition, reveals some connection with the indicators of dynamism of the excitatory process, namely: with an average conditional effect (r = -0.423; p < 0.1) and with the duration of the alpha-rhythm blockade on the first sound (r = 0.303; p> 0.1).
We associate the dynamism of excitation mainly with the activity of the reticular formations of the brain (Nebylitsyn, 1964 b). At the same time, beta-activity is often considered as a function of activating reticular influences. Based on this, we could expect to find a positive relationship between the indicators of beta-activity and the indicators of the dynamism of arousal, but the problem is that this relationship is more negative than positive. This can be seen from the comparison of group averages. When dividing the subjects into groups according to the dynamism of arousal (Table 4) it turns out that both the frequency and the total energy, and the beta-rhythm index are on average higher in subjects with a small conditional reflex effect, i.e. with low dynamicity of excitation, and the differences in all three indicators are statistically significant.
In addition, comparing groups of subjects differing in the dynamism of the braking process (Table 3), it can be found that both the frequency, energy, and beta-rhythm index are higher not in those individuals who have low indicators of dynamic inhibition, but, on the contrary, in subjects with high indicators of this property (although the difference in the average values of the beta-index is statistically insignificant). It is currently difficult to give any effective explanation to these facts. If we were talking only about the total energy and the beta-rhythm index, we could assume that the beta-rhythm, being perhaps the second harmonic of the alpha-rhythm, follows the parameters of the alpha-activity with its parameters, for which the specified direction of relations is “normal”. However, the frequency of the beta-rhythm is not directly related to the frequency of the alpha-rhythm, as one would expect with the assumption of harmonic relations between them, but rather the reverse (Table 3 and 4). Therefore, the question of the reasons for the described nature of the relationship between beta-activity parameters and dynamism indicators should remain open for now.
As for the indicators related to the theta-rhythm, it turned out during correlation processing that only the total energy of them has a stable tendency to a negative relationship with a number of activation indicators (Table 2). However, when comparing the averages, another curious dependence is found: subjects with high dynamism of excitation have on average a noticeably lower frequency of theta-rhythm than persons with low dynamism of arousal, and the same can be said about subjects with low dynamism of the braking process in contrast to individuals with highly dynamic braking; the difference in averages, especially in the first case, is statistically highly significant (Table 3 and 4). Translating this into the language of traditional terms, we can say that subjects with a predominance of arousal tend to have a slower theta-rhythm compared to subjects with a predominance of inhibition. This trend is the opposite of the one that is characteristic of the alpha-rhythm, but is similar to the trend already noted above, found for the frequency of the beta-rhythm.
Summarizing the data on the relationship between the dynamics of nervous processes and the indicators of the electroencephalographic background, it can be noted that such a relationship apparently exists, but it is mostly very far from functional and is revealed mainly by statistical evaluation of differences between averages. At the same time, some rhythms tend to one kind of dynamism, others to another, for example, the alpha-rhythm shows a greater connection with the dynamism of the inhibitory process, and the beta-rhythm, rather, with the dynamism of excitation. In some cases, such an opposite direction of dependencies is characteristic of individual indicators of the same rhythm, for example, the frequency of the theta- rhythm reveals, judging by the comparison of averages, a greater dependence on the dynamism of excitation, and the theta- index on the dynamism of inhibition. In general, the problem seems too complicated to be fully understood within one or two series of experiments. But at the same time, it seems to be too rich in potential conclusions both for questions concerning the structure and nature of the EEG itself and its components, and for the problematic properties of the nervous system to neglect its thorough study.
1.4. The dynamism of nervous processes and the reaction of imposing rhythm
The study of the reaction of brain bio-currents to the effect of a rhythmic light stimulus (the reaction of imposing a rhythm) holds great possibilities for obtaining results in a differential psychophysiological aspect. This reaction is observed in almost all subjects, even with a visual assessment of the effect, although it is preferable to conduct a detailed study of it using frequency analyzers and integrators that allow recording and quantifying the dynamics of individual sections of the electroencephalogram spectrum. There is a very significant range of individual differences in the rhythm imposition response. It is equally great both when studying the frequency characteristics of reactions, and when determining its dependence on the intensity, color or other parameters of the presented stimulus (Danilova, 1963; Ilyanok, 1961; Povarinsky, 1960; Ulett & Johnson, 1958). In some works these individual variations were compared with some personality traits (Mundy-Castle, 1953; Shagass, 1955; Ulett et al., 1953). In other works, the dependence of the imposition reaction on various states of an object, human or animal was studied (Danilova, 1958, 1959; Dolin & Farber, 1963; Farber, 1960; Golubeva, 1959; Kopylov, 1956, 1960; Kreindler, 1960; Zislina & Novikova, 1962).
The first experience of studying the reaction of imposing rhythm in connection with the properties of the nervous system, as far as we know, was the work of E.A. Golubeva (Golubeva, 1963), performed in the laboratory of B.M. Teplov and aimed at comparing some indicators of the reaction of imposing rhythm with the characteristics of the balance of nervous processes (the latter was determined by V.I. Rozhdestvenskaya by the ratio of the rates of formation of positive and inhibitory photochemical conditional reactions and, thus, is a characteristic of the balance in terms of dynamism; in addition, it was judged by the galvanic skin indicator).
In this work, it was found – however, on a small number of subjects – that individuals with a predominance of arousal have a certain tendency to better impose low stimulation frequencies – from 1.5 to 7 Hz. This fact was presumably explained by E.A. Golubeva by the well-known fact that some individuals with a predominance of arousal tend to quickly fall into an inhibitory, sleepy state, which is characterized by just a more pronounced imposition of slow frequencies. Following this work, a whole group of studies was carried out in the laboratory of psychophysiology to determine the role of the properties of the nervous system in various parameters of the rhythm imposition reaction (Golubeva, 1965; Golubeva & Schwartz, 1965; Nebylitsyn, 1964 c, d). One of such studies was a complex experiment we set up, in which the indicators were compared: (1) imposition of rhythms in the range from 5 to 22 Hz and at different intensities of the light stimulus, (2) indicative and conditionally reflex blockade of the alpha-rhythm when exposed to sound and light stimuli and their combinations, and (3) “background” features of the electroencephalogram, more precisely, its components isolated using a frequency analyzer.
Let’s focus on the results of quantitative processing of these comparisons, which are relevant to the problem of dynamism of nervous processes. Those aspects of the rhythm imposition reaction that have found a connection with the problem of the strength of the nervous system will be discussed in the following papers.
Method
Let’s briefly describe the methodological side of the experiment. The subject was in a soundproof chamber in a lying position with his/her eyes open in the dark. Bipolar temporal-occipital abduction on the right was recorded; the choice of abduction was dictated by the desire to obtain the maximum intensity of the alpha-rhythm for a clearer definition of its background features and reactions. The use of bandpass filters that isolated frequencies of 4-7, 8-13 and 14-25 Hz from the EEG (Kozhevnikov, 1954) made it possible to register its components simultaneously with the electroencephalogram on three other feathers: theta-, alpha- and beta-activity; inclusion in the integrator circuit (Kozhevnikov, Soroko, 1959) made it possible to quantify the electrical activity (oscillation energy) in the bands of each of the rhythms allocated. The source of light pulses in experiments with rhythm assimilation was the photostimulator EFS 01; the duration of the light pulse remained constant, amounting to 10 ms, the frequency and intensity varied according to the specific program of the experiment.
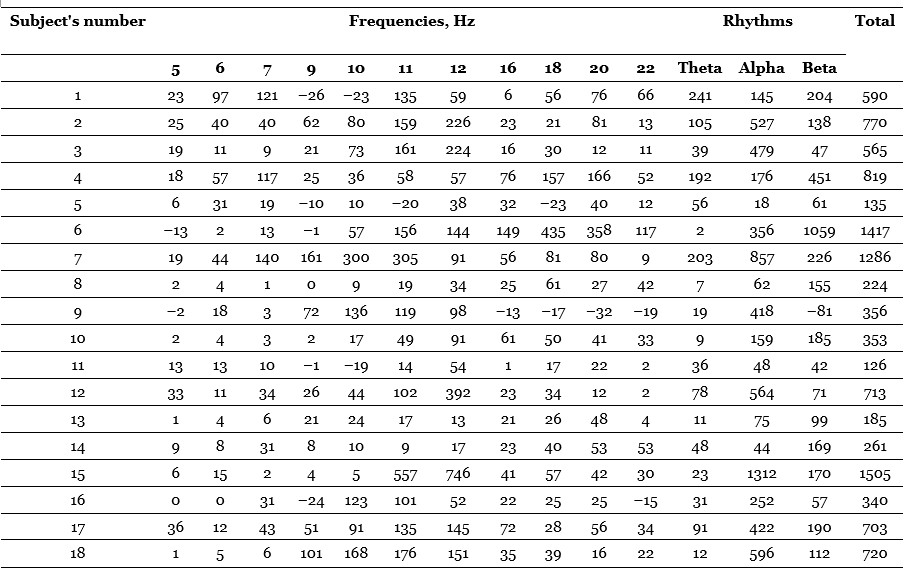
The method of obtaining indicators of imposing rhythm differs somewhat from the one used by most authors. We sought to obtain accurate quantitative indicators of the effect of imposition and applied to this end a technique that allows us to take into account the “pure” effect of imposing rhythm. This technique is as follows. Before proceeding to the presentation of flashing light, we measured the oscillation energy of a given frequency band under the action of continuous light of the same duration (10 s) and the same intensities as rhythmic light. After that, we proceeded to measure the energy in this band under the action of flashing light of the appropriate frequency (in the theta-rhythm band when stimulated with a frequency of 5, 6 and 7 Hz, in the alpha-rhythm band when stimulated with 9, 10, 11 and 12 Hz and in the beta-rhythm band when stimulated with 16, 18, 20 and 22 Hz). The rhythm imposition index was derived as the difference between the second and first indicators and thus means an increase in the total energy of oscillations in a given frequency band under the action of flashing light compared to the energy measured under the action of continuous light; it means, therefore, the “clear” effect of exposure to a rhythmic light stimulus. The final index for each of these frequencies was calculated by summing the indices for the six applied stimulation intensities (25, 50, 100, 200, 500 and 1000 lux). It is designated by us as the energy index of imposing rhythm (EIIR). In addition to calculating the indices for individual frequencies, the calculation of the total EIIR for the frequency bands as a whole, as well as the total index for all the frequencies used, was carried out (by basic “addition”). Individual imposition indices were compared with a number of indicative and conditionally indicative activation reaction indicators; these indicators obtained from those subjects who had a sufficiently pronounced alpha-rhythm (20 out of 25 people) are listed in Table 6. As for background indicators, they include frequency, total energy and theta-index., alpha- and beta-rhythms. The frequency and rhythm index were calculated in one of the experiments near the end of the experimental series; the total energy of each of the frequency bands was measured in each of the three experiments on imposing the rhythm, and then the averages were derived.
Results
We will begin the review of the data obtained by presenting the results of comparing the EIIR for different stimulation frequencies. Individual imposition indices for each of the frequencies, as well as for the three rhythms as a whole and the total EIIR for all frequencies are given in Table 9. Negative values are found in this table. They owe their origin to the fact that in some cases the values of the oscillation energy under the action of continuous light exceed those obtained under the action of flashing light; flashing light, even of those frequencies that correspond to a given rhythm, leads to its greater oppression than continuous. There is a kind of “negative imposition”, observed, however, quite rarely and at strong light intensities less often than at weak ones. As for the comparative effect of stimulation corresponding to different rhythms, then, as can be seen from the table, the highest absolute values belong, as a rule, to the frequencies of the alpha-band, in many cases – to the frequencies of the beta-band and in individual subjects – to the frequencies corresponding to the theta-rhythm. The greatest average effect is observed at a frequency of 12 Hz, then at a frequency of 11 Hz, the lowest effect is given by a frequency of 5 Hz. For greater clarity, these relations are presented in the form of a histogram in Figure 1. So, in the vast majority of subjects, rhythm imposition takes place at all applied stimulation frequencies, including frequencies corresponding to the theta-rhythm, in which our data are consistent with the results of E.A. Golubeva (Golubeva, 1963) and some other authors. The intercorrelation table (Table 6) shows the values of the EINR correlation coefficients for each frequency with the EIIR for each other frequency. Consideration of this table leads to interesting conclusions.
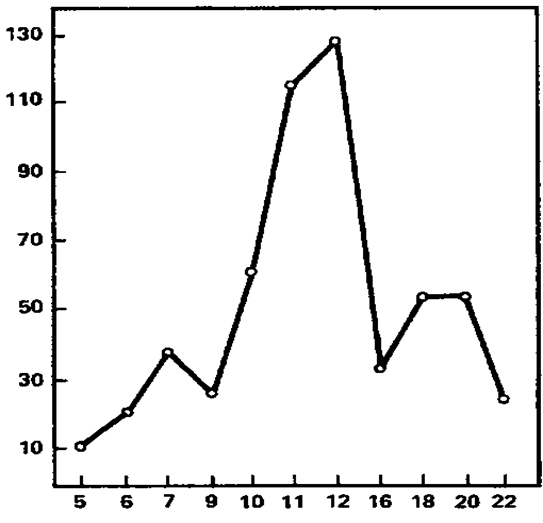
Figure 1. The imposition of rhythm as a function of the frequency of rhythmic light stimulation (average data). The abscissa axis is the frequency of stimulation (Hz); the ordinate axis is the “pure” effect of binding (stand. units).
Table 5. Energy indices of imposing rhythms (Nebylitsyn, 1964 c)
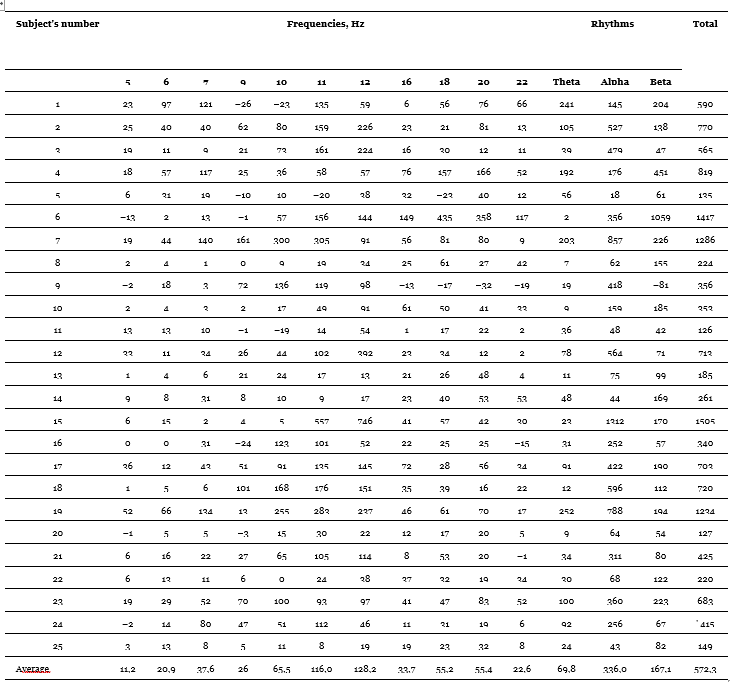
Note. The imposition indices are given in stand. units, which, using a special formula, can be recalculated in mkV/s.
Table 6. Intercorrelations of rhythm imposition indices for different frequencies (V.D. Nebylitsyn, 1964 c)

Figure 2-5 shows examples of how different subjects have a different reaction of imposing a rhythm at different stimulation frequencies. Designations: 1 – the mark of the stimulus action, 2 – theta-rhythm, 3 – alpha-rhythm, 4 – beta-rhythm, 5 – unanalyzed EEG, 6 – time mark.
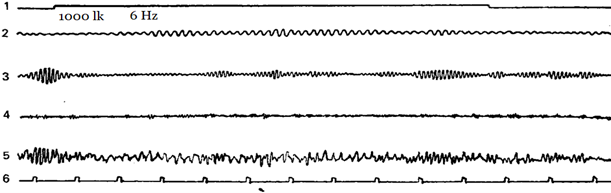
Figure 2. Flashing light with a frequency of 6 Hz causes a pronounced reaction of imposing a rhythm in the theta- and partly in the alpha-band (second harmonic).
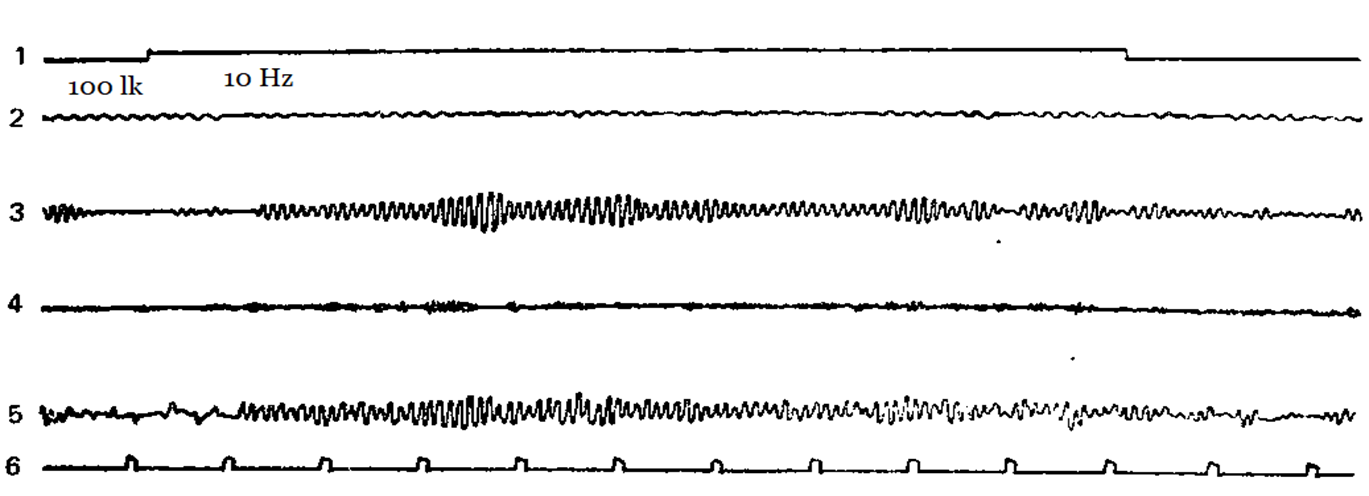
Figure 3. Flashing light with a frequency of 10 Hz leads to the appearance of an imposed rhythm in the alpha-band.
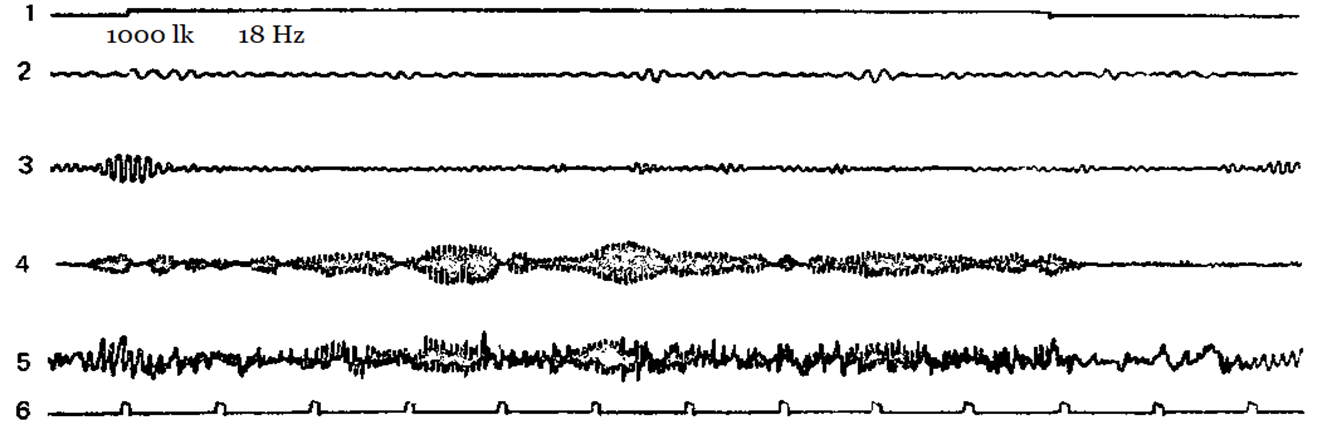
Figure 4. Flashing light with a frequency of 18 Hz causes a pronounced reaction of imposing a rhythm in the beta-band.
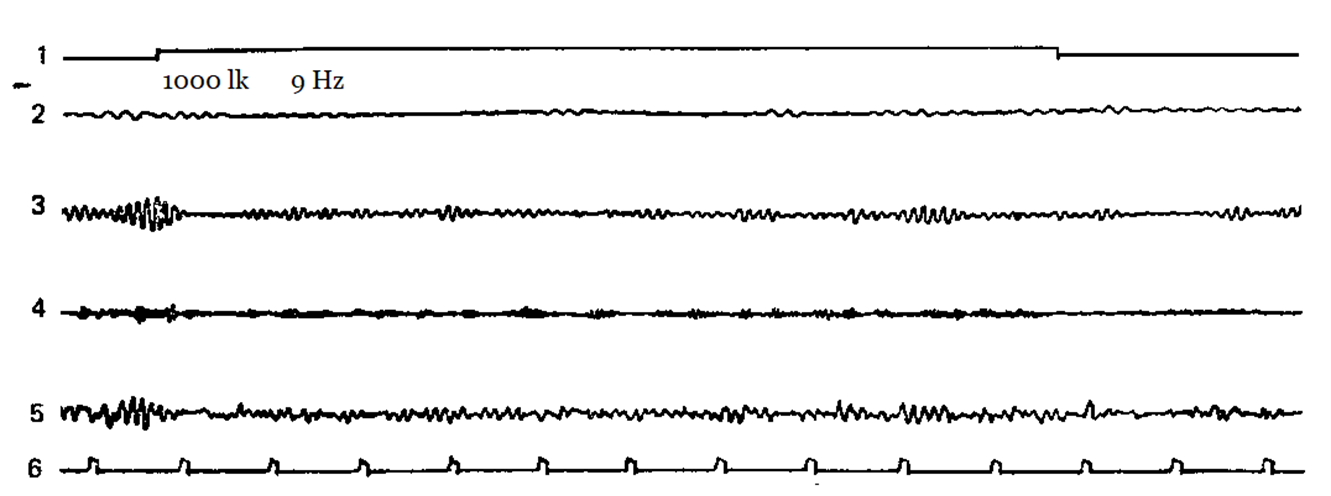
Figure 5. Flashing light with a frequency of 9 Hz doesn’t cause an imposition reaction.
One of them is that the imposition rates for the lowest frequencies – 5, 6 and 7 Hz – at a high level of significance (p < 0.01; p < 0.001) correlate with each other, but almost do not correlate with the imposition rates of other frequencies, especially high ones. At the same time, similar indicators for frequencies lying in the beta-rhythm zone (16, 18, 20, 22 Hz) give extremely high cross-correlations (p < 0.001), but their correlations with indicators of all other frequencies are almost zero. As for the EIIR frequencies included in the alpha-rhythm band (9, 10, and 12 Hz), they not only do not correlate with the rest of the indicators, but they are also in a very peculiar relationship with each other, it is the indicators of imposing only neighboring frequencies that correlate: 9 and 10, 10 and 11, 11 and 12 Hz, and note that the first and third pairs correlate at the level of p < 0.001, and the second – only at the minimum level of significance p < 0.05. When comparing the EIIR frequencies of this band “after one” (9 and 11, 10 and 12 Hz) or “after two” (9 and 12 Hz), the correlations turn out to be statistically insignificant or even close to zero. All this means that the imposition of theta-group frequencies is determined by one factor of the nervous system, the imposition of beta-group frequencies is determined by another factor, moreover, judging by the nature of correlations, it is extremely sharply limited from the rest, and in the alpha-band there are perhaps even two factors (although, as can be seen, they are related), one of which determines the effect of imposing
rhythmic stimulation corresponding to a low-frequency alpha rhythm, and the other takes effect when stimulated corresponding to a higher-frequency alpha-rhythm. So, one can think that the neurophysiological mechanisms of the formation of the imposition reaction are different at different frequencies of light stimulation.
It is possible, however, that these very clearly delimited frequency groupings owe their origin to reasons of a more external nature, namely, that the very range of light stimulation frequencies used in the experiment had interruptions just in those intervals that lie on the boundaries of physiological rhythms: frequencies 8, 13, 14 and 15 Hz weren’t used. If these frequencies had been used, then, perhaps, the boundaries between rhythms revealed in the experiment would not have been so distinct. This idea is suggested by the results obtained in the study of the reaction of imposing the rhythm of E.A. Golubeva (1965), who used a much more fractional and wide logarithmic range of frequencies from 2 to 80 Hz.
It should be noted that the methodology of E.A. Golubeva’s work was quite significantly different from ours: she used a narrow-band frequency analyzer, which made it possible to isolate from the EEG a very narrow section of the spectrum corresponding to the frequency of the irritation being applied at the moment, and a pulse counter that counted the number of waves of this frequency with an amplitude above 10 mcV (1963). One of the differences between this method and the one we used is, therefore, that oscillations with an amplitude of less than 10 mcV were not taken into account at all, and with an amplitude of more than 10 mcV were considered the same regardless of their actual magnitude, while the use of the indicator allows you to take into account the energy of oscillations of any amplitude. Another difference lies in the method of calculating the effect of rhythmic stimulation: the index of imposition applied by E.A. Golubeva, served as the number of oscillations (of the specified amplitude for a given period of time) as such, while in our case the index of imposition was the difference between the indicators of the integrator with flashing light and with continuous light stimulation.
There is no doubt that the difference in the methodology leads to certain differences in the results.
E.A. Golubeva’s data are presented in the form of intercorrelations in Table 7. According to the distribution of coefficients, this table in some respects resembles the matrix obtained by us (table 10), in others it is quite different from the latter. A certain similarity can be seen in the presence of certain groupings of coefficients according to physiological rhythms. Thus, the frequency imposition indices of the delta zone almost do not correlate with the imposition indices of other frequencies, and the same can be said about the imposition of the highest of the applied frequencies (more than 50 Hz), although both, especially the latter, have high internal correlations. The indices of the theta-zone correlate with each other and with the indices of neighboring frequencies related to the low-frequency alpha-rhythm, but weakly correlate with the indices of frequencies corresponding to the higher-frequency alpha-rhythm (10 and 12 Hz). As for the differences in the distribution of correlations, the main one is that the indices of the theta-zone, as well as (to a lesser extent) the alpha-zone, show rather high positive correlations with the indices of imposing frequencies corresponding to the low-frequency beta-rhythm (up to 30-35 Hz).
It should be assumed, therefore, that with this methodological approach to the study of the imposition reaction, the effects of low–frequency (3.5–7 Hz) and medium-frequency (16-35 Hz) stimulation are apparently based on common brain mechanisms, the nature of which, however, is by no means clear at the moment clear. It is possible that this commonality is due to the same reasons why both theta- and beta-activity are often considered to be related to the emotional manifestations of an individual.
Concluding the analysis of the problem of the relationship between the effects of imposing a rhythm at different stimulation frequencies, we believe that, regardless of the methodological differences, we can draw some general conclusions. Probably, there are no sharp edges between the frequency groupings revealed during the study of the imposition reaction and the corresponding individual physiological rhythms, just as there are no sharp edges between the physiological rhythms themselves; this is confirmed at least by the fact that there are very high correlation coefficients between the imposition indices of all adjacent frequencies (table 7). Nevertheless, these frequency groupings themselves seem to be revealed with sufficient distinctness, corresponding, in general, to the basic physiological rhythms.
This conclusion, based on the analysis of statistical processing data, echoes the conclusions reached by some authors as a result of a direct physiological experiment. Thus, A.Y. Supin (1963), analyzing the mechanisms of potential formation under rhythmic light exposure, notes that the responses of the cortex to frequent and rare flashes are “not completely identical”, since they occur at different levels of cortical excitability due to the frequency of flashes. The various mechanisms of formation (in rabbits) of imposed rhythms during stimulation are less often and more often 6-7 Hz are indicated by V.I. Guselnikov and A.Y. Supin (1962). According to R.M. Meshchersky and G.D. Smirnov (1961), reactive potentials arising at different frequencies of light stimulation have differences in their structure and may be associated with the excitation of various elements of the cortex and with varying degrees of participation of nonspecific thalamic nuclei. Japanese authors (Kaneko et al., 1961) observed in cats opposite shifts of imposing slower and more frequent rhythms under conditions of stimulation of reticular formations.
Table 8. Correlation coefficients between energy indices of pacing and resting EEG parameters

Note. *р < 0.05; ** р < 0.01; ***р < 0.001.
All these data, we believe, go in the same direction as the results we have just reviewed. They indicate that the electrical reactions formed in the cortex at different frequencies of stimulation of the sensory apparatus are not unambiguous and, as can be seen, depend on various structural, functional and constitutional factors.
Let us now turn to the consideration of the dependencies between the imposition reaction and the indicators of the electroencephalic background, by which we mean the frequency of rhythms dominating in the bands 4-7, 8-13 and 14-25 Hz selected with the help of filters, the total energy measured in these frequency bands for 10 seconds of rest, and the theta-, alpha- and beta- rhythms in frequency bands, i.e. the percentage of time occupied on the curve by the corresponding rhythm. Studying the correlations between EIIR and these indicators table 8), one can notice a curious relationship, which consists in the fact that the number of significant correlation coefficients between imposition and background indicators increases as the frequency of rhythmic light stimulation decreases.
Indeed, among the correlations of background indicators with the imposition indices in the beta-band (frequencies 16, 18, 20 and 22 Hz), there is not a single significant one even at the level p < 0.05.
The EIIR of two alpha- band frequencies (11 and 12 Hz) have two significant positive correlations with such a background indicator as the total energy of the alpha-rhythm.
The greatest relationship with the EEG background indicators is found by the EIIR frequencies lying in the theta-rhythm zone (5, 6 and 7 Hz), especially the frequencies of 6 Hz. The imposition of this frequency is associated with a positive significant correlation with the indicators of the total energy of all three rhythms, and in two cases – with the energy of the theta-rhythm and alpha-rhythm – these correlations (0.619; 0.507) are significant at the level of p < 0.01. The imposition of frequencies of 5 and 7 Hz also positively correlates with the indicators of the total energy of all three rhythms.
It should also be noted that, although the correlations of the imposition indices of each of the three frequency groups with the indicators of the total energy of the rhythms corresponding to them are mostly statistically insignificant (except for correlations for the theta-zone), they are still mostly consistently positive and, therefore, indicate the manifestation of the same trend. It consists in the presence of a positive relationship between the effect of rhythmic light stimulation and the magnitude of cortical electrical activity. This trend is especially clearly revealed when comparing the indicators of cortical activity with the indices of imposition of those frequencies that correspond to the theta-rhythm band (5, 6, 7 Hz).
Based on these data, it can be assumed that both the magnitude of the electrical activity of the cortex and the imposition of slow rhythms, apparently, are at least partially determined by the same factor of activity of the nervous system acting in the direction of a positive connection between the two phenomena.
In this last point, our data apparently diverge from the materials of E.A. Golubeva (1965), who included in her comparison one of the EEG background indicators – the alpha-index – and obtained negative correlations between this indicator and the effect of imposing slow frequencies (2-8 imp/s), although/ these correlations are not always significant (Table 7). As an estimate of the alpha-index of E.A. Golubeva, the number of alpha-waves with a frequency of 10 Hz was taken, isolated from the initial EEG using a narrowband analyzer and calculated by means of a pulse counter for a certain period of time. In principle, such an indicator as the alpha-index is in a certain sense (but, of course, not completely) similar to the total electrical activity of the alpha-band, so the correlations of both of these indicators with the third one would have to have the same sign. However, in two comparisons, the signs turned out to be opposite.
The reasons for this discrepancy have not yet been clarified, but it can be assumed that the methodological differences noted above in the method of determining the effect of imposition, as well as the features of the alpha-index measurement method used by E.A. Golubeva, played a role here. It is also possible that this discrepancy may be only apparent, since, according to the above-mentioned assumption of E.A. Golubeva (1963), the best imposition of slow frequencies in subjects with a predominance of arousal takes place insofar as these subjects have a tendency to rapid development of sleep inhibition, and the development of inhibition is accompanied by an improvement in imposition just in the area of slow rhythms (Danilova, 1959; Zislina, 1955).
Let us now consider the reaction of imposing rhythm in its comparison with electrographic indicators of the dynamism of nervous processes. A general idea of the nature of the dependencies operating here can be obtained from the graphs shown in pic. 6 and 7, and from Tables 9 and 10. Pic. 6 shows two histograms based on the average EIIR for groups with high (solid line) and low (dotted line) dynamism of the excitatory process, and in Fig. 7 shows the corresponding histograms for groups that differ in the dynamism of braking (solid line – high dynamism, dotted line – low dynamism of the braking process). The following points attract attention here.
The differences that are revealed when comparing group graphs constructed for groups with different dynamics of the braking process are much more distinct (pic. 7). These differences relate only to the frequencies corresponding to the theta- and alpha-rhythm, in the band of which obviously the best EIIR belong to persons with high dynamism of the braking process. In the beta-rhythm band, these differences are practically absent.
The chart for groups differing in the dynamism of excitation (Figure 6) pass almost along their entire length quite close to each other. However, in some areas they are still noticeably diverging. This discrepancy is evident in the area of stimulation frequencies corresponding to the beta-rhythm, where the imposition is more pronounced in individuals with reduced dynamism of arousal.
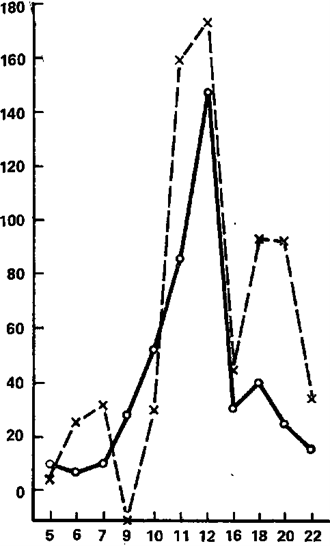
Figure 6. The rhythm imposition reaction as a function of the stimulation frequency on average in groups with high (solid line) and low (dotted line) dynamism of the excitatory process
The abscissa axis is the frequency of stimulation (Hz); the ordinate axis is the effect of imposition (stand. unit).
A similar difference is observed in the frequency zone adjacent to the beta-band – 11 and 12 Hz, as well as frequencies included in the theta-rhythm band. From this rule, only the frequencies 9 and 10 Hz are distinguished, the imposition of which has (perhaps accidentally) the opposite character. Thus, in general, subjects with high dynamism of the excitatory process are characterized by slightly worse indices of rhythm imposition than subjects with low dynamism of excitation. The differences that are revealed when comparing group graphs constructed for groups with different dynamics of the braking process are much more distinct (pic. 7). These differences relate only to the frequencies corresponding to the theta- and alpha-rhythm, in the band of which obviously the best EIIR belong to persons with high dynamism of the braking process. In the beta-rhythm band, these differences are practically absent. So, if the division on the basis of the dynamism of excitation reveals differences in the imposition of mainly higher frequencies (from 11 to 22 Hz), then the division on the dynamism of inhibition leads to the identification of differences mainly in the zone of low-frequency stimulation covering the bands of theta- and alpha-rhythms, and on the second sign, the subjects differentiate much more clearly. Statistical analysis of the significance of the noted differences indicates that most of them are not accidental, and this especially applies to differences in the dynamism of the braking process.
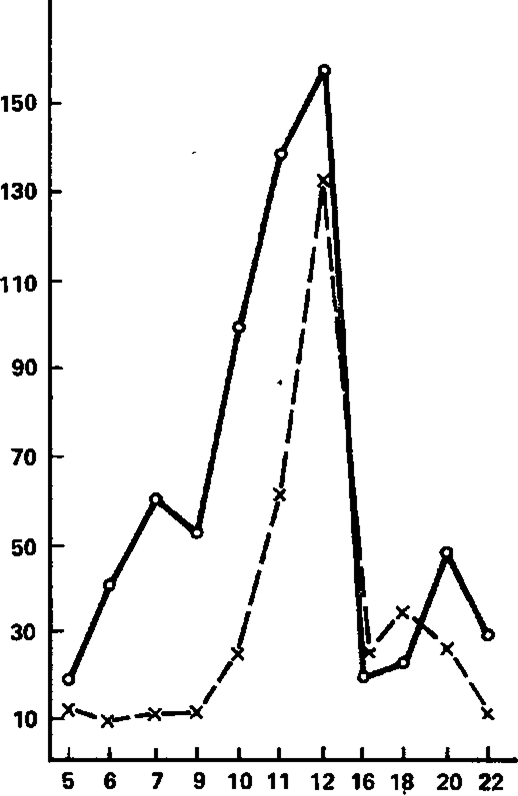
Figure 7. The pacing reaction as a function of stimulation frequency, on average, in groups with high (solid line) and low (dashed line) dynamics of the inhibitory process.
The abscissa axis is the stimulation frequency (imp/s); the y-axis is the effect of imposition (conventional units)
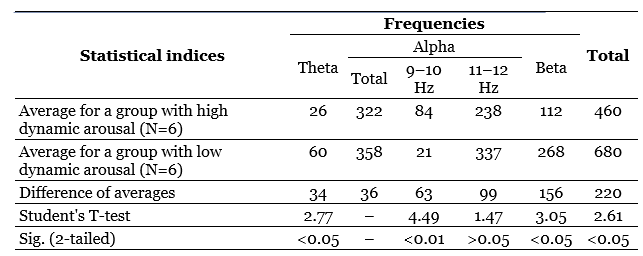
An assessment of these differences is given in Table 13, from which it can be seen that the difference in the average EIIR for low stimulation frequencies (up to 10 Hz inclusive) statistically, it is very significant, and the difference in the average EIIR for higher frequencies (11 Hz or more) does not reach the level of significance. The differences at low stimulation frequencies are so great that the difference in the total EIIR (total for all frequencies used) also turns out to be statistically significant. Evaluation of the differences in the EIIR depending on the dynamism of excitation (Table 10) shows that these differences are for the most part either significant at a minimum 5% level, or completely insignificant, as, for example, when comparing the total EIIR for the alpha-band.
Table 9. Statistical analysis of the differences between the average total indices of rhythm imposition for groups with high and low dynamism of the inhibitory process

Table 10. Evaluation of the differences in the EIIR depending on the dynamism of excitation
Conclusions
Based on statistical analysis, the following conclusions can be drawn:
(1) the imposition of theta-band frequencies and the statistical evaluation of the differences between the average total indices of rhythm imposition for groups with high and low dynamism of the excitatory process depends very significantly on the dynamism of the inhibitory process; the imposition of frequencies of the alpha-zone (9-10 Hz); the imposition of frequencies the beta-
bands (in the range of 16-22 Hz studied by us) and the adjacent frequencies of the alpha-zone, as statistical processing shows, do not depend on the dynamism of braking;
(2) the dependence of the imposition of the rhythm of all frequencies on the dynamism of the excitatory process is generally much weaker and, in statistical evaluation, is on average somewhere on the verge of significance;
(3) the direction of dependencies as a whole is such that high indices of imposing low frequencies belong mainly to persons with high dynamic inhibition, and high indices of imposing high (within the studied limits) frequencies are characteristic, as a rule – though with less certainty – to persons with low dynamic excitation.
In the language of traditional terms, this means that the best imposition of all frequencies is more often observed in “unbalanced” individuals characterized by the predominance of the inhibitory process. The fact that suggests a connection between the imposition of rhythm in the low frequency band and the dynamism of inhibition can be compared with data from various authors indicating a connection between bioelectric activity in the slow rhythm band, and in particular theta-rhythm, and the development of cortical inhibition in the development of extinction (Hernandez-Peon, 1962; Gastaut et al., 1957), differentiation (Gastaut et al., 1957; Yoshii et al., 1962; Rabinovich, 1961) or memorization (Yus & Yus, 1954; Yoshii et al., 1962), as well as when introducing narcotic substances (Khapazhev, 1962). Some authors (Danilova, 1959; Zislina, 1955) also report a connection between the development of inhibition and imposition in the field of slow rhythms. Our data stand somewhat apart here, since they do not concern the development of the braking state, but individual differences in the dynamism of braking. However, the basis for the interpretation of the above literature and our experimental data concerning the imposition of slow rhythms, apparently, remains the same. Both literary and our own data seem to indicate that slow rhythmic cortex – both background and when imposing rhythm – is to a certain extent an expression of the prevailing inhibitory tendency.
Limitations
It seems to us that it is still premature to draw concrete conclusions based on the materials of this chapter. Although there is, apparently, a direct influence of such a parameter of nervous activity as the dynamism of nervous (especially inhibitory) processes on a number of indicators of the resting electroencephalogram and its changes in the levels of rhythmic light stimulation. This influence, as one could see, is far from unambiguous and unidirectional both in relation to different rhythms (and, accordingly, stimulation frequencies) and in relation to various indicators characterizing these rhythms.
At this stage of the study of EEG correlates of the basic properties of the nervous system, the fundamental conclusion is more important that such correlates can still be detected and characterized even with the initial approach, even if only with the help of statistical criteria. Any manifestation of individuality in the functions of the central nervous system cannot ultimately be determined by one or another combination of properties of the nervous system. We are deeply convinced that this fully applies to the dynamics of brain biopotentials. Further experimental work will help to reveal and characterize in detail those dependencies and relationships that link the basic properties of the nervous system and the individual characteristics of the electrical rhythm of the cerebral cortex.
References
- Beckman, F. H. & Stein, A. (1961). A note on the relationship between per cent alpha time and efficiency in problem solving. Psychology, V. 51.
- Bogachenko, V. P. (1960). Add to selected about changes in the electroencephalogram of patients suffering from manic-depressive psychosis. Questions of electrophysiology and encephalography. [Bogachenko V.P. Ob izmenenii elektroencefalogrammy bol’nyh, stradayushchih maniakal’no-depressivnym psihozom // Voprosy elektrofiziologii i encefalografii, 1960].
- Brazier, M. А. В., Finesinger, J. E., & Cobb, S. (1945). A contrast between the electroencephalograms of 100 psychoneurotic patients and those of 500 normal adults. American Journal of Psychiatry, V. 101.
- Danilova, N. N. (1958). On the dependence of the restructuring reaction of brain biocurrents on the orienting reflex to a rhythmic light stimulus. Orienting reflex and orienting-research activity. [Danilova N.N. O zavisimosti reakcii perestrojki biotokov mozga ot orientirovochnogo refleksa na ritmichnyj svetovoj razdrazhitel’ // Orientirovochnyj refleks i orientirovochno-issledovatel’skaya deyatel’nost’., M., 1958].
- Danilova, N. N. (1963). On the individual features of the electrical activity of the human cerebral cortex. Tipological features of the higher nervous activity of man., 1963. Vol. 3. [Danilova N.N. Ob individual’nyh osobennostyah elektricheskoj aktivnosti kory bol’shih polusharij cheloveka // Tipologicheskie osobennosti vysshej nervnoj deyatel’nosti cheloveka. M., 1963. T. III].
- De Lange, J., Storm Van Leeuwen, W., & Verre, P. F. (1962). Correlation between psychological and encephalographic phenomena. Electroencephalographic studies of higher nervous activity. [De Lange Dzh., Storm Van Leven V., Verre P.F. Korrelyaciya mezhdu psihologicheskimi i encefalograficheskimi yavleniyami // Elektroencefalograficheskie issledovaniya vysshej nervnoj deyatel’nosti. M., 1962].
- Dolin, A. O., Farber, D. A. (1963). The value of the reaction of assimilation of the rhythm of light flashes in the assessment of functional mobility. Abstracts of the XX meeting on problems of higher nervous activity. [Dolin A. O., Farber D. A. Znachenie reakcii usvoeniya ritma svetovyh mel’kanij v ocenke funkcional’noj podvizhnosti // Tezisy XX soveshchaniya po problemam vysshej nervnoj deyatel’nosti. L., 1963].
- Dondero, A., Hofstaetter, P., & O’Connor, J. (1956). Critical flicker frequency and cortical alpha. Electroencephalography and Clinical Neurophysiology, V. 8.
- Ellingson, R. J. (1956). Brain waves and problems of psychology. Psychological Bulletin, V. 53.
- Farber, D. A. (1960). On the role of the reticular formation of dogs in the reaction of assimilation of the rhythm of light flickers. Abstracts of the 1st conference on the problems of the reticular formation. [Farber D. A. O roli retikulyarnoj formacii sobak v reakcii usvoeniya ritma svetovyh mel’kanij // Tezisy I konferencii po problemam retikulyarnoj formacii. M., 1960].
- Gastaut, H. (1954). The brain stem and cerebral electrogenesis in relation to consciousness. Brain mechanisms and consciousness.
- Gastaut, H., Gastaut, G., & Roget, A. (1951). Etude electrographique du cycle d’excitabilite cortical. Electroencephalography and Clinical Neurophysiology, V. 3.
- Gasteau, A., Roger, A., Dongier, S., & Regis, A. (1957). The study of EEG equivalents of the processes of central excitation and central inhibition during the development of a conditioned reflex. Journal of Higher Nervous Activity, 7(2). [Gasto A., Rozhe A., Donzh’e S, Rezhi A. Izuchenie EEG ekvivalentov processov central’nogo vozbuzhdeniya i central’nogo tormozheniya pri vyrabotke uslovnogo refleksa // Zhurnal vysshej nervnoj deyatel’nosti. 1957. T. VII. Vyp. 2].
- Golikov, N. V. (1956). Physiological foundations of the theory of electroencephalography. Questions of the theory and practice of electroencephalography. [Golikov N.V. Fiziologicheskie osnovy teorii elektroencefalografii // Voprosy teorii i praktiki elektroencefalografii, 1956].
- Golubeva, E. A. (1963) An attempt to study the reaction of rearrangement of brain biocurrents as an indicator of individual differences in the balance of nervous processes. Typological features of higher nervous activity of a person, Vol. 3 [Golubeva E.A. Popytka issledovaniya reakcii perestroki biotokov mozga kak pokazatelya individual’nyh razlichij po uravnoveshennosti nervnyh processov // Tipologicheskie osobennosti vysshej nervnoj deyatel’nosti cheloveka. 1963. T. III].
- Golubeva, E. A. (1965) Reaction of restructuring of biocurrents of the brain and typological properties of the nervous system. Typological features of higher nervous activity of a person, Vol. 4. [Golubeva E.A. Reakciya perestrojki biotokov mozga i tipologicheskie svojstva nervnoj sistemy // Tipologicheskie osobennosti vysshej nervnoj deyatel’nosti cheloveka. 1965. T. IV].
- Golubeva, E. A., & Schwartz, L. A. (1965). The ratio of bioelectric indicators of lability with critical flicker frequency and the rate of recovery of light sensitivity. Typological features of higher nervous activity of a person, Vol. IV. [Golubeva E.A., Shvarc L.A. Sootnoshenie bioelektricheskih pokazatelej labil’nosti s KCHM i skorost’yu vosstanovleniya svetovoj chuvstvitel’nosti // Tipologicheskie osobennosti vysshej nervnoj deyatel’nosti cheloveka. 1965. T. IV].
- Golubeva, L. Ya. (1959). On the reflection of inhibition in the EEG in animals. Proceedings of the Institute of Higher Nervous Activity of the Academy of Sciences of the USSR, Vol. 3. [Golubeva L.YA. Ob otrazhenii tormozheniya v EEG u zhivotnyh // Trudy Instituta vysshej nervnoj deyatel’nosti AN SSSR. 1959. T. 3].
- Gurevich, K. M. (1965). On the validity of laboratory tests of strength and balance of nervous processes (according to the results of a study of a group of workers from the operational duty personnel of power systems). Typological features of higher nervous activity of a person, Vol. 4 [Gurevich K.M. O validnosti laboratornyh prob sily i balansa nervnyh processov (po rezul’tatam izucheniya gruppy rabotnikov iz operativnogo dezhurnogo personala energosistem) // Tipologicheskie osobennosti vysshej nervnoj deyatel’nosti cheloveka.1965. T. IV].
- Guselnikov, V. I. & Supin, A. Ya. (1962) Some mechanisms of the reaction of “imposing a rhythm”. Physiological journal, 48(4). [Gusel’nikov V.I., Supin A.YA. Nekotorye mekhanizmy reakcii «navyazyvaniya ritma» // Fiziologicheskij zhurnal. 1962. T. 48. № 4].
- Hernandez-Peon, R. (1962). Reticular mechanism of sensory control. Sensory Communication.Y.
- Ilyanok, V. A. (1961). Influence of intensity and depth of flickering light pulsation on the electrical activity of the human brain. Biophysics, 4(1). [Il’yanok V.A. Vliyanie intensivnosti i glubiny pul’sacii mel’kayushchego sveta na elektricheskuyu aktivnost’ mozga cheloveka // Biofizika. 1961. T. VI. Vyp. 1].
- Johnson, L. C. & Ulett, G. A. (1959). Stability of EEG activity and manifest anxiety. Physiological Psychology, V. 52.
- Kaneko, Z., Hidaka, A., Hishikana, A., Shimizu, A., & Miyazaki, K. (1961). Effects of arousal stimulation upon photic driving in the cat. Folia Psychiatrica et Neurologica Japonica, V. 15.
- Khapazhev, T. Sh. (1962). On the relationship between the nature of the electrocorticogram and the magnitude of the excitability of the cerebral cortex during direct electrical stimulation. Bulletin of Leningrad State University, No 15. [Hapazhev T.Sh. O sootnoshenii mezhdu harakterom elektrokortikogrammy i velichinoj vozbudimosti kory golovnogo mozga pri pryamom elektricheskom razdrazhenii // Vestnik LGU. 1962. № 15.]
- Kopylov, A. G. (1956). Evaluation of the functional state of the human brain by the method of electroencephalographic curves of rhythm assimilation. Problems of theory and practice of electroencephalography. [Kopylov A.G. Ocenka funkcional’nogo sostoyaniya golovnogo mozga cheloveka metodom elektroencefalograficheskih krivyh usvoeniya ritma // Voprosy teorii i praktiki elektroencefalografii., 1956.]
- Kopylov, A. G. (1960). Changes in the physiological characteristics of the brain under the influence of drugs and stimulants. Nervous System, No 2. [Kopylov A.G. Izmeneniya fiziologicheskih harakteristik golovnogo mozga pri dejstvii narkotikov i stimulyatorov // Nervnaya sistema. 1960. Vyp. 2].
- Kozhevnikov, V. A. (1954). Method of automatic analysis of biocurrents (electronic analyzer of biocurrents of the brain). Physiological journal, N0 4. [Kozhevnikov V. A. Metod avtomaticheskogo analiza biotokov (elektronnyj analizator biotokov golovnogo mozga) // Fiziologicheskij zhurnal. 1954. № 4].
- Kozhevnikov, V. A. & Soroko, V. I. (1959). Electronic meter of changes in the alpha rhythm of the electroencephalogram arising from the application of irritations. Problems of physiological acoustics, Vol. 4. [Kozhevnikov V.A., Soroko V.I. Elektronnyj izmeritel’ izmenenij al’fa-ritma elektroencefalogrammy, voznikayushchih pri nanesenii razdrazhenij // Problemy fiziologicheskoj akustiki. 1959. T. 4].
- Kreindler, A. (1960). Epilepsy: Clinical and experimental studies. M. [Krejndler A. Epilepsiya: Klinicheskie i eksperimental’nye issledovaniya. M., 1960].
- Lindsley, D. B. (1952). Phychological phenomena and the EEG. Electroencephalography and Clinical Neurophysiology, V. 4.
- Livanov, M. N. (1940). On the uneven development of some frequency processes that make up the electrocerebrogram, and on Berger’s rhythm. Physiological journal, 18(2–3). [Livanov M. N. O neravnomernom razvitii nekotoryh chastotnyh processov, slagayushchih elektrocerebrogrammu, i o ritme Bergera // Fiziologicheskij zhurnal. 1940. T. XVIII. Vyp. 2–3].
- Loomis, A. L., Harvey, E., & Hobart, G. (1936). Electrical potentials of the human brain. Journal of Experimental Psychology, V. 19.
- Mangan, G. L., & Adcock, C. (1962). EEG correlates of perceptual vigilance and defence. Percept. Motor Skills, V. 14.
- Meshchersky, R. M., & Smirnov, G. D. (1961). On the origin of the rhythmic reaction of the cerebral cortex to flashing light. Doklady AN USSR, 139(1). [Meshcherskij R.M., Smirnov G.D. O proiskhozhdenii ritmicheskoj reakcii kory mozga na mel’kayushchij svet // Doklady AN SSSR. 1961. T. 139. № 1].
- Mundy-Castle, A. C. (1953). An analysis of central responses to photic stimulation in normal adults. Electroencephalography and Clinical Neurophysiology, V. 5.
- Mundy-Castle, A. C. (1957). L’electroencephalogramme et sa relation avec le temperament. Conditionnement et reactive en electroencephalographie.
- MсАdаm, W. & Orme, J. E. (1954) Personality traits and the normal electroencephalogram. Merit Research Journal of Medicine and Medical Sciences. V, 100.
- Nebylitsyn, V. D. (1963). Electroencephalographic study of the properties of the strength of the nervous system and the balance of nervous processes in humans using factorial analysis. Typological features of higher nervous activity, V. 3. [Nebylicyn V.D. Elektroencefalograficheskoe izuchenie svojstv sily nervnoj sistemy i uravnoveshennosti nervnyh processov u cheloveka s primeneniem fakto-rial’nogo analiza // Tipologicheskie osobennosti vysshej nervnoj deyatel’nosti. M., 1963. T. III].
- Nebylitsyn, V. D. (1964). Cortico-reticular relations and their place in the structure of the properties of the nervous system. Questions of Psychology, No. 1. [Nebylicyn V. D. Kortiko-retikulyarnye otnosheniya i ih mesto v strukture svojstv nervnoj sistemy // Voprosy psihologii. 1964. № 1].
- Nebylitsyn, V. D. (1964). On the factors of individual differences in the reactions of brain biocurrents to flickering light exposure. Journal of Higher Nervous Activity, 14(2). [Nebylicyn V.D. O faktorah individual’nyh razlichij v reakciyah biotokov mozga na mel’kayushchee svetovoe vozdejstvie // Zhurnal vysshej nervnoj deyatel’nosti. 1964. T. XIV. Vyp. 2].
- Nebylitsyn, V.D. (1965). Dynamism of nervous processes and individual features of the electroencephalogram of rest in humans. Typological features of higher nervous activity in humans. Vol. 4. [Nebylicyn V. D. Dinamichnost’ nervnyh processov i individual’nye osobennosti elektroencefalogrammy pokoya u cheloveka // Tipologicheskie osobennosti vysshej nervnoj deyatel’nosti u cheloveka. 1965. T. IV].
- Nebylitsyn, V. D. (1964). Rhythm imposing reaction as a function of the intensity of a flickering light stimulus. Journal of Higher Nervous Activity, 14(4). [Nebylicyn V.D. Reakciya navyazyvaniya ritma kak funkciya intensivnosti mel’kayushchego svetovogo razdrazhitelya // Zhurnal vysshej nervnoj deyatel’nosti. 1964. T. XIV. Vyp. 4].
- Nelson, G. K. (1960). The measurement and significance of brain rhythms. Transactions of the South African Institute of electrical engineers, V. 51.
- Povorinsky, A. G (1960). Some features of electroencephalogram responses to rhythmic light in normal conditions and in diseases of the central nervous system. Reports of the APS of the RSFSR, No 5. [Povorinskij A.G. Nekotorye osobennosti otvetov elektroencefalogrammy na ritmicheskij svet v norme i pri zabolevaniyah central’noj nervnoj sistemy // Doklady APN RSFSR. 1960. № 5].
- Rabinovich, M. Ya. (1961). Electrophysiological analysis of the activity of various layers of the cerebral cortex during the formation of a conditioned reflex. Journal of Higher Nervous Activity, 11(3). [Rabinovich M.YA. Elektrofiziologicheskij analiz aktivnosti razlichnyh sloev kory bol’shih polusharij pri formirovanii uslovnogo refleksa // Zhurnal vysshej nervnoj deyatel’nosti. 1961. T. XI. № 3].
- Roget, A. (1960). Correlations between the different electroencephalographic variables. Electroencephalography and Clinical Neurophysiology, V. 12.
- Saul, L., Davis, A., & Davis, P. A. (1949). Psychological correlations with the electroen-cephalogram. Electroencephalography and Clinical Neurophysiology, V. 1.
- Shagass C. (1955) Differentiation between anxiety and depression by the photically activated electroencephalogram. American Journal of Psychiatry, V. 112.
- Shpilberg, P. I. (1940). On the human electroencephalogram. Physiological journal, 28(2–3). [Shpil’berg P. I. Ob elektroencefalogramme cheloveka // Fiziologicheskij zhurnal. 1940. T. 28. Vyp. 2–3].
- Supin, A. Ya. (1963). Mechanisms of the reaction of rhythm rearrangement and reflection of the functional state of the cortex in the parameters of this reaction. Electrophysiology of the nervous system. [Supin A.YA. Mekhanizmy reakcii perestrojki ritma i otrazhenie funkcional’nogo sostoyaniya kory v parametrah etoj reakcii // Elektrofiziologiya nervnoj sistemy. 1963.]
- Ulett, G. A., Gteser, G., Winokur, G., & Lawler, A. (1953). The EEG and reaction to photic stimulation as an index of anxiety-proneness. Electroencephalography and Clinical Neurophysiology, V. 5.
- Ulett, G. A., & Johnson, L. C. P. (1958), Stability and correlates of photic-electroencepha-lographic activation. The Journal of Nervous and Mental Disease, V. 126.
- Were, P. F. (1957). The relationships between electroencephalografic and psychological data in normal adults.
- Yoshii, N., Matsumoto, J., Ogura, X., Shimokochi, M., Yamaguchi, V., & Yamasaki, G. (1962). Conditioned reflex and electroencephalography. Electroencephalographic studies of higher nervous activity. [Ioshii N., Macumoto Dzh., Ogura X., SimokoTi M., YAmaguti V., YAmasaki G. Uslovnyj refleks i elektroencefalografiya // Elektroencefalograficheskie issledovaniya vysshej nervnoj deyatel’nosti. M., 1962].
- Yus, A. & Yus, K. (1954). An EEG attempt to analyze the processes of internal inhibition (delay and its transition to sleep). Journal of Neuropathology and Psychiatry, 54(9). [Yus A., Yus K – Popytka EEG analiza processov vnutrennego tormozheniya (zapazdyvaniya i ego perekhoda v son) // Zhurnal nevropatologii i psihiatrii. 1954. T. 54. Vyp. 9].
- Zislina, N. N. (1955). Electrophysiological study of the functional mobility of the brain of children by the method of rhythmic light stimulation. Journal of Higher Nervous Activity, 5(5). [Zislina N.N. Elektrofiziologicheskoe issledovanie funkcional’noj podvizhnosti mozga detej metodom ritmicheskih svetovyh razdrazhenij // Zhurnal vysshej nervnoj deyatel’nosti. 1955. T. V. Vyp. 5].
- Zislina, N. N. & Novikova, L. A. (1962). Investigation of the role of specific and non-specific afferent systems in the reaction of rhythm assimilation. Physiological journal, 48(4). [Zislina N. N., Novikova L. A. Issledovanie roli specificheskoj i nespecificheskoj afferentnyh sistem v reakcii usvoeniya ritma // Fiziologicheskij zhurnal. 1962. T. 48. № 4].
Translated by D. A. Dokuchaev.
Comments (0)
Vladimir Nebylitsyn (July 21, 1930 – October 1, 1972) was a member of the Academy of Pedagogical Sciences of the USSR. He was one of those who were at the origins of the creation of the Institute of Psychology of the USSR (named like the Institute of Psychology of the Russian Academy of Sciences now), whose efforts made this major step in the development of psychological science in Russia, associated with its promotion in the field of recognition by the scientific community.
In his work, V. Nebylitsyn was associated with many scientific institutions: The Psychological Institute of the Russian Academy of Sciences, the Institute of Psychology of the Russian Academy of Sciences, the Faculty of Psychology of Moscow University, many institutes in Moscow, Leningrad, Tbilisi, and other cities of the country. He was vice-president of the All-Union Society of Psychologists, deputy chairman, member of the editorial board and deputy executive editor of several major scientific journals.
He played a particularly important role in the fate of the Institute of Psychology of the Russian Academy of Sciences. The very fact of the Institute’s existence is inextricably linked with the name of Vladimir Nebylitsyn. Together with Boris Lomov, the first director of the Institute of Psychology of the Russian Academy of Sciences, Vladimir Nebylitsyn carried out the work of the young institution, determined its spirit, selected employees, invested directly in the arrangement of the institute premises.
From the first days of the foundation of the Institute of Psychology of the USSR Academy of Sciences (1971), he was deputy director and head of the Laboratory of Differential Psychology. V. Nebylitsyn believed that differential psychophysiology is the most productive of all the biological theories of personality development proposed so far. Its obvious advantages stem from the fact that it takes as a starting point not the secondary or secondary signs of biological organization, such as, for example, morphological indicators (signs of the bodily constitution in the theories of Kretschmer or Sheldon), but the signs of the central nervous system. The advantages of neurophysiological factors of individual psychological differences are confirmed by the whole course of the development of ideas and. Pavlov researchers working in the field of studying the basic properties of the nervous system, both in the field of purely physiological study of them, and in the field of research of their psychological manifestations and correlates (Nebylitsyn, 1971).
On the basis of B. Teplov’s research, V.D. Nebylitsyn developed the basic principles of differential psychophysiology. He proved Teplov’s hypothesis about the inverse relationship between the strength of the nervous system and sensitivity. He described the properties of the nervous system developed by Teplov (mobility, lability). Introduced a new term – dynamism. He has developed a number of electrophysiological methods for studying the dynamics of nervous processes occurring in the brain. He hypothesized about the general properties of the nervous system that underlie such personal characteristics as activity and self-regulation. One of the pioneers of the use of factor analysis in Soviet psychology.
V.D. Nebylitsyn identified three leading components in temperament related to the spheres of the individual’s general activity, his/her motor skills and his/her emotionality. Each of these components, in turn, has a very complex multidimensional structure and different forms of psychological manifestations.
The first component in the structure of temperament is the general mental activity of the individual. The essence of this component lies in the tendency of the individual to self-expression, effective development and transformation of external reality. According to the author, the degrees of activity are distributed from lethargy, inertia, passive contemplation at one pole to the highest degrees of energy, powerful impetuosity of actions and constant ascent at the other.
The second component of temperament is motor, in which the leading role is played by qualities related to the function of the locomotion (and primarily speech-motor) apparatus. V.Nebylitsyn attached special importance to motor skills as a means by which the internal dynamics of mental states with all its individual gradations is actualized. Among the dynamic qualities of the motor component are: speed, strength, sharpness, rhythm, amplitude and a number of other signs of muscle movement (some of them characterize speech motor skills).
The third component of temperament is emotionality, which is an extensive complex of properties and qualities that characterize the peculiarities of the emergence, flow and termination of various feelings, affects and moods. This component is the most complex and has its own branched structure. The main characteristics of emotionality are impressionability, impulsivity and emotional lability. Impressionability expresses the affective susceptibility of the subject, his sensitivity to emotional influences, his ability to find the ground for an emotional reaction where there is no such ground for others. Impulsivity is the speed with which emotion becomes the motivating force of actions and actions without their prior consideration and conscious decision to carry them out. Emotional lability refers to the rate at which a given emotional state ceases or one experience is replaced by another.
V.D. Nebylitsyn is the author of more than 80 scientific publications. The most breakthrough studies are presented in the monographs “Basic properties of the human nervous system” (1966) and “Psychophysiological studies of individual differences” (1976).
References
- Brushlinsky, A.V. & Ushakova, T.N. (1996). V.D. Nebylitsyn: life and scientific work”, M. Ladomir [Brushlinskiy A.V., Ushakova T.N. (1996). V.D. Nebylitsyn: zhizn’ i nauchnaya deyatel’nost’», M. Ladomir].
- Nebylitsyn, V.D. (1971). Actual problems of differential psychophysiology. Voprosy Psychologii, 6, 13-14, 19-25 [Nebylitsyn V.D. (1971). Aktual’nyye problemy differentsial’noy psikhofiziologii. Voprosy psikhologii, 6, 13-14, 19-25].
Manifestations of the Dynamism of the Nervous System in some Electroencephalographic Parameters
In: Nebylitsyn, V.D. Manifestations of the Dynamism of the Nervous System in some Electroencephalographic Parameters. In V. D. Nebylitsyn (1966). Basic properties of the nervous system, Moscow, p. 110-131.
Abstract: As is well known, electroencephalography provides the researcher with a number of convenient indicators of the basic properties of the nervous system, and in particular the dynamism of nervous processes based on the study of the phenomenon of activation, in other words blockade, suppression of the dominant rhythm. The only, but, unfortunately, important restriction of this method, which prevents its widespread use for the study of individual characteristics, is the lack of a sufficiently clear pronounced alpha-rhythm in some normal adult individuals (about 15-20%) and, consequently, the impossibility of applying to them methods based on determining the parameters of indicative and conditionally reflex activation. This important restriction to the widespread use of the EEG method can be overcome if such electroencephalographic indicators are found that are not reduced to the parameters of the activation reaction and themselves reflect certain properties of the nervous system. This paper includes some preliminary results to solve this problem. We will consider two issues here. One of them concerns the relationship between the dynamism of nervous processes and indicators of rest EEG or background indicators of EEG, and the other – the correlation between the dynamism of nervous processes and indicators of one of the frequently used “functional loads”, namely, the reaction of imposing the rhythm of a flashing light stimulus.
Background EEG indicators and dynamism of nervous processes
The electroencephalogram differs from other recordable bioelectric or vegetative functions of a living organism in that it can be assumed to carry a huge amount of meaningful psychophysiological information, which is encrypted in the form of a continuous sequence of vibrations with a rather complex configuration. The task of decoding this information, i.e. establishing possible correlations between certain characteristics of the electrical activity of the brain, on the one hand, and some psychological or physiological parameters of the individual, on the other hand, has long attracted the attention of researchers.
At the same time, it should be borne in mind that the breadth of studying these background indicators is directly dependent on the arsenal of technical means of EEG analysis that the researcher has. In the presence of only one recording device, only a visual assessment of the electroencephalogram is possible, mainly according to the parameters of the dominant rhythm, and obtaining some of the simplest numerical values. Therefore, in the early works of electrophysiologists, mainly indicators related to the alpha-rhythm are analyzed: index, frequency and amplitude, and only recently, with the development of automatic analyzing technology, similar characteristics of other rhythms have been seriously studied, as well as a number of indicators based on mathematical processing of a continuous wave process, which in essence and is an EEG.
It was found that background EEG indicators are characterized by significant stability and for each given individual they form a unity that changes little over time (Loomis et al., 1936; Livanov, 1940; Shpilberg, 1940). At the same time, the general pattern of the EEG curve and the characteristics of individual parameters of the bioelectric activity of the brain varies very significantly from one individual to another, thereby suggesting that the elements that make up the electroencephalogram are in a certain dependence on some deep and stable qualities of individuality, first of all, obviously, of a psychophysiological nature.
This reason was guided by many authors who investigated the features of the main rhythms of the electroencephalogram in the aspect of personality characteristics (Lindsley, 1952; Ellingson, 1956; Gastaut, 1954; Were, 1957).
Although not all such attempts have resulted in the establishment of certain positive correlations, nevertheless, observations, guesses and assumptions of various authors have given us reason to think that, if not all, then at least some EEG parameters may be in some connection with the most stable personality traits – the main properties of the nervous system that form the basis of a number of human psychological personal characteristics. Some competent authors directly point to this possibility. So, N.V. Golikov said: “A special classification of the types of electrical activity should be associated with the characteristics of the types of higher nervous activity” (Golikov, 1956, p. 11). Indirect data in favor of such an assumption can be systematized as follows.
Based on the fact that concentration of attention and emotional arousal cause blockade of the alpha-rhythm, some authors have investigated the question of a possible relationship between the alpha-index and the tendency of subjects to a neurotic state of “anxiety”, that is increased emotional tension with the fixation of the subject on various negative, in his opinion, circumstances and factors.
The data turned out to be very contradictory. If M. Brazier (Brazier et al., 1945) assumed that EEG without alpha-rhythm reflect a tendency to anxiety, then A. Dondero (Dondero et al., 1956) indicates the absence of a significant correlation between the alpha-index and anxiety. L. Johnson and G. Ulett (Johnson & Ulett, 1959) found that the amount of alpha-activity reveals a connection with anxiety, but only when measured in the first experiment, when this activity turns out to be markedly reduced in people prone to anxiety. After the subject gets used to the situation, the connection of these two indicators is no longer observed. A curious dependence was observed by F. Beckman and M. Stein (Beckman & Stein, 1961), who obtained a significant negative correlation between the success of solving logical problems and the alpha-index on 33 subjects; they suggest that people who solve problems better and individuals with a low alpha-index have the same common feature: a higher level of cortical arousal.
The amplitude of the alpha-rhythm can in point of view be considered as an indicator similar to the alpha-index: states of attention and tension lead to a decrease in the amplitude of the alpha-rhythm in the same way as the alpha-index. With respect to the amplitude, therefore, the same assumptions are possible as with respect to the alpha-index. Indeed, Н. Gastaut and co-authors (Gastaut et al., 1951) characterize individuals with a high–voltage alpha-rhythm as “slow, calm, balanced”, and with a low-voltage one – as hypersensitive, hyperemotional, hyperactive. L. Saul and co-authors (Saul et al., 1949) associate a high amplitude with passivity and a tendency to avoid responsibility and effort, and a low amplitude with opposite qualities. A. Mundy-Castle (Mundy-Castle, 1957) notes “slowness, caution, balance” in individuals with a high amplitude of alpha-rhythm and inverse qualities in persons with a low-voltage alpha-rhythm. J. De Lange and co-authors (De Lange et al., 1962) found that subjects with an increased amplitude of alpha-rhythm and a high alpha-index were psychologically characterized by activity, self-confidence and lack of tension or anxiety, in general – stability, and subjects with low amplitude and alpha-rhythm index – opposite qualities: tension, anxiety, insufficient adequacy of behavior.
The least variable EEG indicator – the frequency of the alpha-rhythm – reveals, apparently, the least connection with the psychophysiological qualities of the individual. However, some authors (Brazier et al., 1945) found on a large material that the frequency of the alpha-rhythm in people with symptoms of anxiety is on average slightly higher than in normal people (11.2 and 10.6 Hz, respectively), and A. Mundy-Castle (Mundy-Castle, 1957) believes that persons with a relatively higher frequency of alpha-rhythm (more than 10 Hz) have a tendency to a sharp, impulsive, unstable reaction, while persons with a lower frequency – to a more depressive behavior, but the dependencies they found are still not enough a certain character.
All three of these indicators related to the alpha-rhythm reveal, based by some literature data, a certain relationship between them. So, A. Roget (Roget, 1960) notes that all indicators related to the alpha-rhythm are interconnected, although not very closely. We also point to the systematization of Н. Gastaut (Gastaut, 1954), who classified the results of a number of authors and his own and came to the conclusion that it is possible to distinguish the main types (syndromes) of electrographic recording, within each of which the alpha-index, the frequency of the alpha-rhythm and amplitude are in a certain correspondence, as well as the features of the distribution of more frequent activity, imposing rhythm and reaction to hyperventilation. In particular, hyperexcitability syndrome is characterized by the presence of periods of desynchronization (hence, a reduced alpha-index), a high frequency (11-13 Hz) of alpha-rhythm, its small amplitude, and hypovexcitability syndrome is characterized by a high amplitude, continuous, without desynchronization intervals alpha-rhythm-frequency of 8-9 Hz. Of course, this classification reflects only the main trends, which the author himself notes, but the direction of these trends deserves attention.
It can be considered very likely that the psychological qualities mentioned by the listed authors in connection with certain features of alpha-activity reflect some properties of the nervous system, it is only necessary to establish which ones. The analysis shows that the closest thing to these qualities is this property of the nervous system, which is usually designated as a balance of nervous processes and which, apparently, should be considered as a balance of nervous processes in terms of dynamism. Then, in general, a low-amplitude, high–frequency alpha-rhythm with frequent periods of desynchronization should correspond to high dynamism of excitation, and a high-amplitude, low-frequency alpha-rhythm recorded continuously should correspond to high dynamism of braking. This proposal was tested by us in comparison of the three indicated parameters of the alpha-rhythm with a number of indicators of indicative and conditionally indicative activation.
1.1 Correlation among resting EEG indicators and electrocortical balance indicators of nervous processes
The results of this comparison in the form of grade correlation coefficients are given in Table 1, which is an extraction from the intercorrelation matrix of all the indicators studied in this table (Nebylitsyn, 1963 b, 1961 c). In this table, attention is drawn to the high correlation between the alpha-index and the amplitude of alpha-waves (note that the maximum amplitude was measured, and not the average, as usual), equal to +0.60 (p < 0.01); some connection also exists between the alpha-index and the frequency of the alpha-rhythm (p = 0.37; p> 0.05), and the correlation between amplitude and frequency is close to zero.
When comparing these background indicators with activation response indicators, it turns out that the alpha-index has quite high correlations with many of these indicators and that correlations of the alpha-rhythm frequency are also significant in some cases; as for the alpha-rhythm amplitude, although all its correlation coefficients with activation indicators are negative, which indicates despite a certain trend, none of them is statistically significant. During factorial processing, both activation indicators and background indicators entered into the same factor, which we can now define as the balance of nervous processes by dynamism. Thus, there are grounds to assume that, if not all, then some indicators of EEG alpha-activity are associated with the dynamism of nervous processes, determined using electroencephalographic techniques.
This conclusion was tested in the second series of electroencephalographic experiments conducted on approximately the same number of subjects; the only difference between the series was that instead of the amplitude of the alpha-rhythm, another indicator was taken for comparison in the second series, namely the total energy of the alpha-rhythm, measured using an electronic integrator (Nebylitsyn, 1965 a).
1.2. Correlation among indicators of the dynamism of nervous processes and the EEG background
The results turned out to be partially different from those obtained in the first series (Table 2). If the alpha-index still gave fairly high correlations with dynamism indicators, then the frequency of the alpha-rhythm this time found no connection with any of these indicators. As for the total energy of the alpha-range, this indicator, which is a function of the amplitude and the alpha-rhythm index, correlates with the dynamism indicators at about the same level (or slightly higher) as the amplitude (Table 1 and 2); in this case, the direction of correlation coincides with that which is characteristic of the alpha-index.
So, two separately conducted studies have shown a generally satisfactory coincidence of the results in the part that concerns the relationship between alpha-rhythm indicators and indicators of the dynamism of nervous processes. The only exception is the frequency of the alpha-rhythm, the correlations of which in the first series were quite high, and in
the second they fluctuate around zero. However, the influence of the dynamism of nervous processes on the frequency of the alpha-rhythm still exists. It can be opened with the help of another method of statistical tests, for the success of which the presence of “graduated and proportionate” relations between the studied parameters is not necessary (Gurevich, 1965 a). We are talking about assessing the significance of the differences between the average values of the two extreme groups of subjects selected based on the results of determining the dynamism of excitation or inhibition in them. The use of this method made it possible to show that in this sample, the dependence of the alpha-rhythm frequency, as well as other indicators of the EEG background, on dynamism exists and even has a rather significant character.
Table 1. Grade correlation coefficients between resting EEG indicators and electrocortical balance indicators of nervous processes (Nebylitsyn, 1963 b)
Note: *р < 0.05; **р < 0.01.
Table 2. Correlation coefficients between indicators of the dynamism of nervous processes and the EEG background
Table 3. Statistical evaluation of differences between the average EEG background values for groups with high and low dynamism of the inhibitory process
Table 4. Statistical evaluation of differences between the average EEG background values for groups with high and low dynamics of the excitatory process
1.3. Differences between the average EEG background values for groups with high and low dynamism of the inhibitory process
Table 3 presents the values of averages, their differences, criteria t and probabilities of the null hypothesis tested relative to the compared averages. This table compares the groups formed on the basis of one of the main indicators of the dynamism of the braking process – the rate of extinction of the conditional reaction. It can be seen that the difference between the averages of the total energy of the alpha-band and the alpha-index is very significant and that the difference in the frequency of the alpha-rhythm is also quite significant, although at first glance the difference in the averages is too small here. At the same time, persons with high dynamic inhibition (with rapid extinction of the conditioned reaction) have, on average, a lower frequency of the alpha-rhythm and higher values of the alpha-rhythm and the total energy of the alpha-stripe, which is a function of the index and amplitude of the alpha-rhythm. It is curious that if the same comparison is carried out for groups that differ in the dynamism of the excitatory process (by the average duration of the conditioned reflex activation reaction), the differences turn out to be much less distinct in two out of three cases (Table 4), namely, the difference in the frequency of the alpha-rhythm practically disappears, although the difference in total energy remains significant, but only at the 5%-level, and only the difference in the average values of the alpha-index increases even more.
So, the use of a statistical criterion that is in some sense more sensitive than the correlation coefficient allows us to confirm the conclusions regarding the dependence of the indicators related to the alpha-rhythm of the EEG on the dynamism of nervous processes and, moreover, to clarify these conclusions by indicating that a more significant role in the variations in the frequency and energy of the alpha-rhythm apparently, the dynamism of the braking process plays a role, while the alpha-index, apparently, equally depends on the dynamism of braking and on the dynamism of excitation.
As already mentioned, in the second series of our electroencephalographic experiments, an electronic analyzer was used (Kozhevnikov, 1954), which allowed, in addition to the alpha-rhythm, to isolate frequency bands belonging to beta- (14-25 Hz) and theta- (4-7 Hz) rhythms from the initial EEG. Therefore, we had the opportunity to compare with the indicators of the dynamism of nervous processes some characteristics of these two physiological rhythms, namely frequency, total energy for 10 second time intervals and index.
The literature data on beta-rhythm generally agree that increased beta-activity is one of the signs of increased emotionality, excitability, activity, etc. (Bogachenko, 1960; Mangan & Adcock, 1962; МсАdаm & Orme, 1954; Nelson, 1960; Werre, 1957), it could be assumed that high values of indicators related to the beta-band may be associated with high values of the dynamism of the excitatory process.
Correlation analysis shows that these assumptions are generally not justified (Table 2): the frequency of the beta-rhythm (in this band) does not correlate with the indicators of the dynamism of excitation, the total energy of the beta-band, like the total energy in the alpha-rhythm range, has negative correlations with these indicators, but far from significant; and only the beta-index, completely uncorrelated with the indicators of dynamism of inhibition, reveals some connection with the indicators of dynamism of the excitatory process, namely: with an average conditional effect (r = -0.423; p < 0.1) and with the duration of the alpha-rhythm blockade on the first sound (r = 0.303; p> 0.1).
We associate the dynamism of excitation mainly with the activity of the reticular formations of the brain (Nebylitsyn, 1964 b). At the same time, beta-activity is often considered as a function of activating reticular influences. Based on this, we could expect to find a positive relationship between the indicators of beta-activity and the indicators of the dynamism of arousal, but the problem is that this relationship is more negative than positive. This can be seen from the comparison of group averages. When dividing the subjects into groups according to the dynamism of arousal (Table 4) it turns out that both the frequency and the total energy, and the beta-rhythm index are on average higher in subjects with a small conditional reflex effect, i.e. with low dynamicity of excitation, and the differences in all three indicators are statistically significant.
In addition, comparing groups of subjects differing in the dynamism of the braking process (Table 3), it can be found that both the frequency, energy, and beta-rhythm index are higher not in those individuals who have low indicators of dynamic inhibition, but, on the contrary, in subjects with high indicators of this property (although the difference in the average values of the beta-index is statistically insignificant). It is currently difficult to give any effective explanation to these facts. If we were talking only about the total energy and the beta-rhythm index, we could assume that the beta-rhythm, being perhaps the second harmonic of the alpha-rhythm, follows the parameters of the alpha-activity with its parameters, for which the specified direction of relations is “normal”. However, the frequency of the beta-rhythm is not directly related to the frequency of the alpha-rhythm, as one would expect with the assumption of harmonic relations between them, but rather the reverse (Table 3 and 4). Therefore, the question of the reasons for the described nature of the relationship between beta-activity parameters and dynamism indicators should remain open for now.
As for the indicators related to the theta-rhythm, it turned out during correlation processing that only the total energy of them has a stable tendency to a negative relationship with a number of activation indicators (Table 2). However, when comparing the averages, another curious dependence is found: subjects with high dynamism of excitation have on average a noticeably lower frequency of theta-rhythm than persons with low dynamism of arousal, and the same can be said about subjects with low dynamism of the braking process in contrast to individuals with highly dynamic braking; the difference in averages, especially in the first case, is statistically highly significant (Table 3 and 4). Translating this into the language of traditional terms, we can say that subjects with a predominance of arousal tend to have a slower theta-rhythm compared to subjects with a predominance of inhibition. This trend is the opposite of the one that is characteristic of the alpha-rhythm, but is similar to the trend already noted above, found for the frequency of the beta-rhythm.
Summarizing the data on the relationship between the dynamics of nervous processes and the indicators of the electroencephalographic background, it can be noted that such a relationship apparently exists, but it is mostly very far from functional and is revealed mainly by statistical evaluation of differences between averages. At the same time, some rhythms tend to one kind of dynamism, others to another, for example, the alpha-rhythm shows a greater connection with the dynamism of the inhibitory process, and the beta-rhythm, rather, with the dynamism of excitation. In some cases, such an opposite direction of dependencies is characteristic of individual indicators of the same rhythm, for example, the frequency of the theta- rhythm reveals, judging by the comparison of averages, a greater dependence on the dynamism of excitation, and the theta- index on the dynamism of inhibition. In general, the problem seems too complicated to be fully understood within one or two series of experiments. But at the same time, it seems to be too rich in potential conclusions both for questions concerning the structure and nature of the EEG itself and its components, and for the problematic properties of the nervous system to neglect its thorough study.
1.4. The dynamism of nervous processes and the reaction of imposing rhythm
The study of the reaction of brain bio-currents to the effect of a rhythmic light stimulus (the reaction of imposing a rhythm) holds great possibilities for obtaining results in a differential psychophysiological aspect. This reaction is observed in almost all subjects, even with a visual assessment of the effect, although it is preferable to conduct a detailed study of it using frequency analyzers and integrators that allow recording and quantifying the dynamics of individual sections of the electroencephalogram spectrum. There is a very significant range of individual differences in the rhythm imposition response. It is equally great both when studying the frequency characteristics of reactions, and when determining its dependence on the intensity, color or other parameters of the presented stimulus (Danilova, 1963; Ilyanok, 1961; Povarinsky, 1960; Ulett & Johnson, 1958). In some works these individual variations were compared with some personality traits (Mundy-Castle, 1953; Shagass, 1955; Ulett et al., 1953). In other works, the dependence of the imposition reaction on various states of an object, human or animal was studied (Danilova, 1958, 1959; Dolin & Farber, 1963; Farber, 1960; Golubeva, 1959; Kopylov, 1956, 1960; Kreindler, 1960; Zislina & Novikova, 1962).
The first experience of studying the reaction of imposing rhythm in connection with the properties of the nervous system, as far as we know, was the work of E.A. Golubeva (Golubeva, 1963), performed in the laboratory of B.M. Teplov and aimed at comparing some indicators of the reaction of imposing rhythm with the characteristics of the balance of nervous processes (the latter was determined by V.I. Rozhdestvenskaya by the ratio of the rates of formation of positive and inhibitory photochemical conditional reactions and, thus, is a characteristic of the balance in terms of dynamism; in addition, it was judged by the galvanic skin indicator).
In this work, it was found – however, on a small number of subjects – that individuals with a predominance of arousal have a certain tendency to better impose low stimulation frequencies – from 1.5 to 7 Hz. This fact was presumably explained by E.A. Golubeva by the well-known fact that some individuals with a predominance of arousal tend to quickly fall into an inhibitory, sleepy state, which is characterized by just a more pronounced imposition of slow frequencies. Following this work, a whole group of studies was carried out in the laboratory of psychophysiology to determine the role of the properties of the nervous system in various parameters of the rhythm imposition reaction (Golubeva, 1965; Golubeva & Schwartz, 1965; Nebylitsyn, 1964 c, d). One of such studies was a complex experiment we set up, in which the indicators were compared: (1) imposition of rhythms in the range from 5 to 22 Hz and at different intensities of the light stimulus, (2) indicative and conditionally reflex blockade of the alpha-rhythm when exposed to sound and light stimuli and their combinations, and (3) “background” features of the electroencephalogram, more precisely, its components isolated using a frequency analyzer.
Let’s focus on the results of quantitative processing of these comparisons, which are relevant to the problem of dynamism of nervous processes. Those aspects of the rhythm imposition reaction that have found a connection with the problem of the strength of the nervous system will be discussed in the following papers.
Let’s briefly describe the methodological side of the experiment. The subject was in a soundproof chamber in a lying position with his/her eyes open in the dark. Bipolar temporal-occipital abduction on the right was recorded; the choice of abduction was dictated by the desire to obtain the maximum intensity of the alpha-rhythm for a clearer definition of its background features and reactions. The use of bandpass filters that isolated frequencies of 4-7, 8-13 and 14-25 Hz from the EEG (Kozhevnikov, 1954) made it possible to register its components simultaneously with the electroencephalogram on three other feathers: theta-, alpha- and beta-activity; inclusion in the integrator circuit (Kozhevnikov, Soroko, 1959) made it possible to quantify the electrical activity (oscillation energy) in the bands of each of the rhythms allocated. The source of light pulses in experiments with rhythm assimilation was the photostimulator EFS 01; the duration of the light pulse remained constant, amounting to 10 ms, the frequency and intensity varied according to the specific program of the experiment.
The method of obtaining indicators of imposing rhythm differs somewhat from the one used by most authors. We sought to obtain accurate quantitative indicators of the effect of imposition and applied to this end a technique that allows us to take into account the “pure” effect of imposing rhythm. This technique is as follows. Before proceeding to the presentation of flashing light, we measured the oscillation energy of a given frequency band under the action of continuous light of the same duration (10 s) and the same intensities as rhythmic light. After that, we proceeded to measure the energy in this band under the action of flashing light of the appropriate frequency (in the theta-rhythm band when stimulated with a frequency of 5, 6 and 7 Hz, in the alpha-rhythm band when stimulated with 9, 10, 11 and 12 Hz and in the beta-rhythm band when stimulated with 16, 18, 20 and 22 Hz). The rhythm imposition index was derived as the difference between the second and first indicators and thus means an increase in the total energy of oscillations in a given frequency band under the action of flashing light compared to the energy measured under the action of continuous light; it means, therefore, the “clear” effect of exposure to a rhythmic light stimulus. The final index for each of these frequencies was calculated by summing the indices for the six applied stimulation intensities (25, 50, 100, 200, 500 and 1000 lux). It is designated by us as the energy index of imposing rhythm (EIIR). In addition to calculating the indices for individual frequencies, the calculation of the total EIIR for the frequency bands as a whole, as well as the total index for all the frequencies used, was carried out (by basic “addition”). Individual imposition indices were compared with a number of indicative and conditionally indicative activation reaction indicators; these indicators obtained from those subjects who had a sufficiently pronounced alpha-rhythm (20 out of 25 people) are listed in Table 6. As for background indicators, they include frequency, total energy and theta-index., alpha- and beta-rhythms. The frequency and rhythm index were calculated in one of the experiments near the end of the experimental series; the total energy of each of the frequency bands was measured in each of the three experiments on imposing the rhythm, and then the averages were derived.
We will begin the review of the data obtained by presenting the results of comparing the EIIR for different stimulation frequencies. Individual imposition indices for each of the frequencies, as well as for the three rhythms as a whole and the total EIIR for all frequencies are given in Table 9. Negative values are found in this table. They owe their origin to the fact that in some cases the values of the oscillation energy under the action of continuous light exceed those obtained under the action of flashing light; flashing light, even of those frequencies that correspond to a given rhythm, leads to its greater oppression than continuous. There is a kind of “negative imposition”, observed, however, quite rarely and at strong light intensities less often than at weak ones. As for the comparative effect of stimulation corresponding to different rhythms, then, as can be seen from the table, the highest absolute values belong, as a rule, to the frequencies of the alpha-band, in many cases – to the frequencies of the beta-band and in individual subjects – to the frequencies corresponding to the theta-rhythm. The greatest average effect is observed at a frequency of 12 Hz, then at a frequency of 11 Hz, the lowest effect is given by a frequency of 5 Hz. For greater clarity, these relations are presented in the form of a histogram in Figure 1. So, in the vast majority of subjects, rhythm imposition takes place at all applied stimulation frequencies, including frequencies corresponding to the theta-rhythm, in which our data are consistent with the results of E.A. Golubeva (Golubeva, 1963) and some other authors. The intercorrelation table (Table 6) shows the values of the EINR correlation coefficients for each frequency with the EIIR for each other frequency. Consideration of this table leads to interesting conclusions.
Figure 1. The imposition of rhythm as a function of the frequency of rhythmic light stimulation (average data). The abscissa axis is the frequency of stimulation (Hz); the ordinate axis is the “pure” effect of binding (stand. units).
Table 5. Energy indices of imposing rhythms (Nebylitsyn, 1964 c)
Note. The imposition indices are given in stand. units, which, using a special formula, can be recalculated in mkV/s.
Table 6. Intercorrelations of rhythm imposition indices for different frequencies (V.D. Nebylitsyn, 1964 c)
Figure 2-5 shows examples of how different subjects have a different reaction of imposing a rhythm at different stimulation frequencies. Designations: 1 – the mark of the stimulus action, 2 – theta-rhythm, 3 – alpha-rhythm, 4 – beta-rhythm, 5 – unanalyzed EEG, 6 – time mark.
Figure 2. Flashing light with a frequency of 6 Hz causes a pronounced reaction of imposing a rhythm in the theta- and partly in the alpha-band (second harmonic).
Figure 3. Flashing light with a frequency of 10 Hz leads to the appearance of an imposed rhythm in the alpha-band.
Figure 4. Flashing light with a frequency of 18 Hz causes a pronounced reaction of imposing a rhythm in the beta-band.
Figure 5. Flashing light with a frequency of 9 Hz doesn’t cause an imposition reaction.
One of them is that the imposition rates for the lowest frequencies – 5, 6 and 7 Hz – at a high level of significance (p < 0.01; p < 0.001) correlate with each other, but almost do not correlate with the imposition rates of other frequencies, especially high ones. At the same time, similar indicators for frequencies lying in the beta-rhythm zone (16, 18, 20, 22 Hz) give extremely high cross-correlations (p < 0.001), but their correlations with indicators of all other frequencies are almost zero. As for the EIIR frequencies included in the alpha-rhythm band (9, 10, and 12 Hz), they not only do not correlate with the rest of the indicators, but they are also in a very peculiar relationship with each other, it is the indicators of imposing only neighboring frequencies that correlate: 9 and 10, 10 and 11, 11 and 12 Hz, and note that the first and third pairs correlate at the level of p < 0.001, and the second – only at the minimum level of significance p < 0.05. When comparing the EIIR frequencies of this band “after one” (9 and 11, 10 and 12 Hz) or “after two” (9 and 12 Hz), the correlations turn out to be statistically insignificant or even close to zero. All this means that the imposition of theta-group frequencies is determined by one factor of the nervous system, the imposition of beta-group frequencies is determined by another factor, moreover, judging by the nature of correlations, it is extremely sharply limited from the rest, and in the alpha-band there are perhaps even two factors (although, as can be seen, they are related), one of which determines the effect of imposing
rhythmic stimulation corresponding to a low-frequency alpha rhythm, and the other takes effect when stimulated corresponding to a higher-frequency alpha-rhythm. So, one can think that the neurophysiological mechanisms of the formation of the imposition reaction are different at different frequencies of light stimulation.
It is possible, however, that these very clearly delimited frequency groupings owe their origin to reasons of a more external nature, namely, that the very range of light stimulation frequencies used in the experiment had interruptions just in those intervals that lie on the boundaries of physiological rhythms: frequencies 8, 13, 14 and 15 Hz weren’t used. If these frequencies had been used, then, perhaps, the boundaries between rhythms revealed in the experiment would not have been so distinct. This idea is suggested by the results obtained in the study of the reaction of imposing the rhythm of E.A. Golubeva (1965), who used a much more fractional and wide logarithmic range of frequencies from 2 to 80 Hz.
It should be noted that the methodology of E.A. Golubeva’s work was quite significantly different from ours: she used a narrow-band frequency analyzer, which made it possible to isolate from the EEG a very narrow section of the spectrum corresponding to the frequency of the irritation being applied at the moment, and a pulse counter that counted the number of waves of this frequency with an amplitude above 10 mcV (1963). One of the differences between this method and the one we used is, therefore, that oscillations with an amplitude of less than 10 mcV were not taken into account at all, and with an amplitude of more than 10 mcV were considered the same regardless of their actual magnitude, while the use of the indicator allows you to take into account the energy of oscillations of any amplitude. Another difference lies in the method of calculating the effect of rhythmic stimulation: the index of imposition applied by E.A. Golubeva, served as the number of oscillations (of the specified amplitude for a given period of time) as such, while in our case the index of imposition was the difference between the indicators of the integrator with flashing light and with continuous light stimulation.
There is no doubt that the difference in the methodology leads to certain differences in the results.
E.A. Golubeva’s data are presented in the form of intercorrelations in Table 7. According to the distribution of coefficients, this table in some respects resembles the matrix obtained by us (table 10), in others it is quite different from the latter. A certain similarity can be seen in the presence of certain groupings of coefficients according to physiological rhythms. Thus, the frequency imposition indices of the delta zone almost do not correlate with the imposition indices of other frequencies, and the same can be said about the imposition of the highest of the applied frequencies (more than 50 Hz), although both, especially the latter, have high internal correlations. The indices of the theta-zone correlate with each other and with the indices of neighboring frequencies related to the low-frequency alpha-rhythm, but weakly correlate with the indices of frequencies corresponding to the higher-frequency alpha-rhythm (10 and 12 Hz). As for the differences in the distribution of correlations, the main one is that the indices of the theta-zone, as well as (to a lesser extent) the alpha-zone, show rather high positive correlations with the indices of imposing frequencies corresponding to the low-frequency beta-rhythm (up to 30-35 Hz).
It should be assumed, therefore, that with this methodological approach to the study of the imposition reaction, the effects of low–frequency (3.5–7 Hz) and medium-frequency (16-35 Hz) stimulation are apparently based on common brain mechanisms, the nature of which, however, is by no means clear at the moment clear. It is possible that this commonality is due to the same reasons why both theta- and beta-activity are often considered to be related to the emotional manifestations of an individual.
Concluding the analysis of the problem of the relationship between the effects of imposing a rhythm at different stimulation frequencies, we believe that, regardless of the methodological differences, we can draw some general conclusions. Probably, there are no sharp edges between the frequency groupings revealed during the study of the imposition reaction and the corresponding individual physiological rhythms, just as there are no sharp edges between the physiological rhythms themselves; this is confirmed at least by the fact that there are very high correlation coefficients between the imposition indices of all adjacent frequencies (table 7). Nevertheless, these frequency groupings themselves seem to be revealed with sufficient distinctness, corresponding, in general, to the basic physiological rhythms.
This conclusion, based on the analysis of statistical processing data, echoes the conclusions reached by some authors as a result of a direct physiological experiment. Thus, A.Y. Supin (1963), analyzing the mechanisms of potential formation under rhythmic light exposure, notes that the responses of the cortex to frequent and rare flashes are “not completely identical”, since they occur at different levels of cortical excitability due to the frequency of flashes. The various mechanisms of formation (in rabbits) of imposed rhythms during stimulation are less often and more often 6-7 Hz are indicated by V.I. Guselnikov and A.Y. Supin (1962). According to R.M. Meshchersky and G.D. Smirnov (1961), reactive potentials arising at different frequencies of light stimulation have differences in their structure and may be associated with the excitation of various elements of the cortex and with varying degrees of participation of nonspecific thalamic nuclei. Japanese authors (Kaneko et al., 1961) observed in cats opposite shifts of imposing slower and more frequent rhythms under conditions of stimulation of reticular formations.
Table 8. Correlation coefficients between energy indices of pacing and resting EEG parameters
Note. *р < 0.05; ** р < 0.01; ***р < 0.001.
All these data, we believe, go in the same direction as the results we have just reviewed. They indicate that the electrical reactions formed in the cortex at different frequencies of stimulation of the sensory apparatus are not unambiguous and, as can be seen, depend on various structural, functional and constitutional factors.
Let us now turn to the consideration of the dependencies between the imposition reaction and the indicators of the electroencephalic background, by which we mean the frequency of rhythms dominating in the bands 4-7, 8-13 and 14-25 Hz selected with the help of filters, the total energy measured in these frequency bands for 10 seconds of rest, and the theta-, alpha- and beta- rhythms in frequency bands, i.e. the percentage of time occupied on the curve by the corresponding rhythm. Studying the correlations between EIIR and these indicators table 8), one can notice a curious relationship, which consists in the fact that the number of significant correlation coefficients between imposition and background indicators increases as the frequency of rhythmic light stimulation decreases.
Indeed, among the correlations of background indicators with the imposition indices in the beta-band (frequencies 16, 18, 20 and 22 Hz), there is not a single significant one even at the level p < 0.05.
The EIIR of two alpha- band frequencies (11 and 12 Hz) have two significant positive correlations with such a background indicator as the total energy of the alpha-rhythm.
The greatest relationship with the EEG background indicators is found by the EIIR frequencies lying in the theta-rhythm zone (5, 6 and 7 Hz), especially the frequencies of 6 Hz. The imposition of this frequency is associated with a positive significant correlation with the indicators of the total energy of all three rhythms, and in two cases – with the energy of the theta-rhythm and alpha-rhythm – these correlations (0.619; 0.507) are significant at the level of p < 0.01. The imposition of frequencies of 5 and 7 Hz also positively correlates with the indicators of the total energy of all three rhythms.
It should also be noted that, although the correlations of the imposition indices of each of the three frequency groups with the indicators of the total energy of the rhythms corresponding to them are mostly statistically insignificant (except for correlations for the theta-zone), they are still mostly consistently positive and, therefore, indicate the manifestation of the same trend. It consists in the presence of a positive relationship between the effect of rhythmic light stimulation and the magnitude of cortical electrical activity. This trend is especially clearly revealed when comparing the indicators of cortical activity with the indices of imposition of those frequencies that correspond to the theta-rhythm band (5, 6, 7 Hz).
Based on these data, it can be assumed that both the magnitude of the electrical activity of the cortex and the imposition of slow rhythms, apparently, are at least partially determined by the same factor of activity of the nervous system acting in the direction of a positive connection between the two phenomena.
In this last point, our data apparently diverge from the materials of E.A. Golubeva (1965), who included in her comparison one of the EEG background indicators – the alpha-index – and obtained negative correlations between this indicator and the effect of imposing slow frequencies (2-8 imp/s), although/ these correlations are not always significant (Table 7). As an estimate of the alpha-index of E.A. Golubeva, the number of alpha-waves with a frequency of 10 Hz was taken, isolated from the initial EEG using a narrowband analyzer and calculated by means of a pulse counter for a certain period of time. In principle, such an indicator as the alpha-index is in a certain sense (but, of course, not completely) similar to the total electrical activity of the alpha-band, so the correlations of both of these indicators with the third one would have to have the same sign. However, in two comparisons, the signs turned out to be opposite.
The reasons for this discrepancy have not yet been clarified, but it can be assumed that the methodological differences noted above in the method of determining the effect of imposition, as well as the features of the alpha-index measurement method used by E.A. Golubeva, played a role here. It is also possible that this discrepancy may be only apparent, since, according to the above-mentioned assumption of E.A. Golubeva (1963), the best imposition of slow frequencies in subjects with a predominance of arousal takes place insofar as these subjects have a tendency to rapid development of sleep inhibition, and the development of inhibition is accompanied by an improvement in imposition just in the area of slow rhythms (Danilova, 1959; Zislina, 1955).
Let us now consider the reaction of imposing rhythm in its comparison with electrographic indicators of the dynamism of nervous processes. A general idea of the nature of the dependencies operating here can be obtained from the graphs shown in pic. 6 and 7, and from Tables 9 and 10. Pic. 6 shows two histograms based on the average EIIR for groups with high (solid line) and low (dotted line) dynamism of the excitatory process, and in Fig. 7 shows the corresponding histograms for groups that differ in the dynamism of braking (solid line – high dynamism, dotted line – low dynamism of the braking process). The following points attract attention here.
The differences that are revealed when comparing group graphs constructed for groups with different dynamics of the braking process are much more distinct (pic. 7). These differences relate only to the frequencies corresponding to the theta- and alpha-rhythm, in the band of which obviously the best EIIR belong to persons with high dynamism of the braking process. In the beta-rhythm band, these differences are practically absent.
The chart for groups differing in the dynamism of excitation (Figure 6) pass almost along their entire length quite close to each other. However, in some areas they are still noticeably diverging. This discrepancy is evident in the area of stimulation frequencies corresponding to the beta-rhythm, where the imposition is more pronounced in individuals with reduced dynamism of arousal.
Figure 6. The rhythm imposition reaction as a function of the stimulation frequency on average in groups with high (solid line) and low (dotted line) dynamism of the excitatory process
The abscissa axis is the frequency of stimulation (Hz); the ordinate axis is the effect of imposition (stand. unit).
A similar difference is observed in the frequency zone adjacent to the beta-band – 11 and 12 Hz, as well as frequencies included in the theta-rhythm band. From this rule, only the frequencies 9 and 10 Hz are distinguished, the imposition of which has (perhaps accidentally) the opposite character. Thus, in general, subjects with high dynamism of the excitatory process are characterized by slightly worse indices of rhythm imposition than subjects with low dynamism of excitation. The differences that are revealed when comparing group graphs constructed for groups with different dynamics of the braking process are much more distinct (pic. 7). These differences relate only to the frequencies corresponding to the theta- and alpha-rhythm, in the band of which obviously the best EIIR belong to persons with high dynamism of the braking process. In the beta-rhythm band, these differences are practically absent. So, if the division on the basis of the dynamism of excitation reveals differences in the imposition of mainly higher frequencies (from 11 to 22 Hz), then the division on the dynamism of inhibition leads to the identification of differences mainly in the zone of low-frequency stimulation covering the bands of theta- and alpha-rhythms, and on the second sign, the subjects differentiate much more clearly. Statistical analysis of the significance of the noted differences indicates that most of them are not accidental, and this especially applies to differences in the dynamism of the braking process.
Figure 7. The pacing reaction as a function of stimulation frequency, on average, in groups with high (solid line) and low (dashed line) dynamics of the inhibitory process.
The abscissa axis is the stimulation frequency (imp/s); the y-axis is the effect of imposition (conventional units)
An assessment of these differences is given in Table 13, from which it can be seen that the difference in the average EIIR for low stimulation frequencies (up to 10 Hz inclusive) statistically, it is very significant, and the difference in the average EIIR for higher frequencies (11 Hz or more) does not reach the level of significance. The differences at low stimulation frequencies are so great that the difference in the total EIIR (total for all frequencies used) also turns out to be statistically significant. Evaluation of the differences in the EIIR depending on the dynamism of excitation (Table 10) shows that these differences are for the most part either significant at a minimum 5% level, or completely insignificant, as, for example, when comparing the total EIIR for the alpha-band.
Table 9. Statistical analysis of the differences between the average total indices of rhythm imposition for groups with high and low dynamism of the inhibitory process
Table 10. Evaluation of the differences in the EIIR depending on the dynamism of excitation
Based on statistical analysis, the following conclusions can be drawn:
(1) the imposition of theta-band frequencies and the statistical evaluation of the differences between the average total indices of rhythm imposition for groups with high and low dynamism of the excitatory process depends very significantly on the dynamism of the inhibitory process; the imposition of frequencies of the alpha-zone (9-10 Hz); the imposition of frequencies the beta-
bands (in the range of 16-22 Hz studied by us) and the adjacent frequencies of the alpha-zone, as statistical processing shows, do not depend on the dynamism of braking;
(2) the dependence of the imposition of the rhythm of all frequencies on the dynamism of the excitatory process is generally much weaker and, in statistical evaluation, is on average somewhere on the verge of significance;
(3) the direction of dependencies as a whole is such that high indices of imposing low frequencies belong mainly to persons with high dynamic inhibition, and high indices of imposing high (within the studied limits) frequencies are characteristic, as a rule – though with less certainty – to persons with low dynamic excitation.
In the language of traditional terms, this means that the best imposition of all frequencies is more often observed in “unbalanced” individuals characterized by the predominance of the inhibitory process. The fact that suggests a connection between the imposition of rhythm in the low frequency band and the dynamism of inhibition can be compared with data from various authors indicating a connection between bioelectric activity in the slow rhythm band, and in particular theta-rhythm, and the development of cortical inhibition in the development of extinction (Hernandez-Peon, 1962; Gastaut et al., 1957), differentiation (Gastaut et al., 1957; Yoshii et al., 1962; Rabinovich, 1961) or memorization (Yus & Yus, 1954; Yoshii et al., 1962), as well as when introducing narcotic substances (Khapazhev, 1962). Some authors (Danilova, 1959; Zislina, 1955) also report a connection between the development of inhibition and imposition in the field of slow rhythms. Our data stand somewhat apart here, since they do not concern the development of the braking state, but individual differences in the dynamism of braking. However, the basis for the interpretation of the above literature and our experimental data concerning the imposition of slow rhythms, apparently, remains the same. Both literary and our own data seem to indicate that slow rhythmic cortex – both background and when imposing rhythm – is to a certain extent an expression of the prevailing inhibitory tendency.
Limitations
It seems to us that it is still premature to draw concrete conclusions based on the materials of this chapter. Although there is, apparently, a direct influence of such a parameter of nervous activity as the dynamism of nervous (especially inhibitory) processes on a number of indicators of the resting electroencephalogram and its changes in the levels of rhythmic light stimulation. This influence, as one could see, is far from unambiguous and unidirectional both in relation to different rhythms (and, accordingly, stimulation frequencies) and in relation to various indicators characterizing these rhythms.
At this stage of the study of EEG correlates of the basic properties of the nervous system, the fundamental conclusion is more important that such correlates can still be detected and characterized even with the initial approach, even if only with the help of statistical criteria. Any manifestation of individuality in the functions of the central nervous system cannot ultimately be determined by one or another combination of properties of the nervous system. We are deeply convinced that this fully applies to the dynamics of brain biopotentials. Further experimental work will help to reveal and characterize in detail those dependencies and relationships that link the basic properties of the nervous system and the individual characteristics of the electrical rhythm of the cerebral cortex.
- Beckman, F. H. & Stein, A. (1961). A note on the relationship between per cent alpha time and efficiency in problem solving. Psychology, V. 51.
- Bogachenko, V. P. (1960). Add to selected about changes in the electroencephalogram of patients suffering from manic-depressive psychosis. Questions of electrophysiology and encephalography. [Bogachenko V.P. Ob izmenenii elektroencefalogrammy bol’nyh, stradayushchih maniakal’no-depressivnym psihozom // Voprosy elektrofiziologii i encefalografii, 1960].
- Brazier, M. А. В., Finesinger, J. E., & Cobb, S. (1945). A contrast between the electroencephalograms of 100 psychoneurotic patients and those of 500 normal adults. American Journal of Psychiatry, V. 101.
- Danilova, N. N. (1958). On the dependence of the restructuring reaction of brain biocurrents on the orienting reflex to a rhythmic light stimulus. Orienting reflex and orienting-research activity. [Danilova N.N. O zavisimosti reakcii perestrojki biotokov mozga ot orientirovochnogo refleksa na ritmichnyj svetovoj razdrazhitel’ // Orientirovochnyj refleks i orientirovochno-issledovatel’skaya deyatel’nost’., M., 1958].
- Danilova, N. N. (1963). On the individual features of the electrical activity of the human cerebral cortex. Tipological features of the higher nervous activity of man., 1963. Vol. 3. [Danilova N.N. Ob individual’nyh osobennostyah elektricheskoj aktivnosti kory bol’shih polusharij cheloveka // Tipologicheskie osobennosti vysshej nervnoj deyatel’nosti cheloveka. M., 1963. T. III].
- De Lange, J., Storm Van Leeuwen, W., & Verre, P. F. (1962). Correlation between psychological and encephalographic phenomena. Electroencephalographic studies of higher nervous activity. [De Lange Dzh., Storm Van Leven V., Verre P.F. Korrelyaciya mezhdu psihologicheskimi i encefalograficheskimi yavleniyami // Elektroencefalograficheskie issledovaniya vysshej nervnoj deyatel’nosti. M., 1962].
- Dolin, A. O., Farber, D. A. (1963). The value of the reaction of assimilation of the rhythm of light flashes in the assessment of functional mobility. Abstracts of the XX meeting on problems of higher nervous activity. [Dolin A. O., Farber D. A. Znachenie reakcii usvoeniya ritma svetovyh mel’kanij v ocenke funkcional’noj podvizhnosti // Tezisy XX soveshchaniya po problemam vysshej nervnoj deyatel’nosti. L., 1963].
- Dondero, A., Hofstaetter, P., & O’Connor, J. (1956). Critical flicker frequency and cortical alpha. Electroencephalography and Clinical Neurophysiology, V. 8.
- Ellingson, R. J. (1956). Brain waves and problems of psychology. Psychological Bulletin, V. 53.
- Farber, D. A. (1960). On the role of the reticular formation of dogs in the reaction of assimilation of the rhythm of light flickers. Abstracts of the 1st conference on the problems of the reticular formation. [Farber D. A. O roli retikulyarnoj formacii sobak v reakcii usvoeniya ritma svetovyh mel’kanij // Tezisy I konferencii po problemam retikulyarnoj formacii. M., 1960].
- Gastaut, H. (1954). The brain stem and cerebral electrogenesis in relation to consciousness. Brain mechanisms and consciousness.
- Gastaut, H., Gastaut, G., & Roget, A. (1951). Etude electrographique du cycle d’excitabilite cortical. Electroencephalography and Clinical Neurophysiology, V. 3.
- Gasteau, A., Roger, A., Dongier, S., & Regis, A. (1957). The study of EEG equivalents of the processes of central excitation and central inhibition during the development of a conditioned reflex. Journal of Higher Nervous Activity, 7(2). [Gasto A., Rozhe A., Donzh’e S, Rezhi A. Izuchenie EEG ekvivalentov processov central’nogo vozbuzhdeniya i central’nogo tormozheniya pri vyrabotke uslovnogo refleksa // Zhurnal vysshej nervnoj deyatel’nosti. 1957. T. VII. Vyp. 2].
- Golikov, N. V. (1956). Physiological foundations of the theory of electroencephalography. Questions of the theory and practice of electroencephalography. [Golikov N.V. Fiziologicheskie osnovy teorii elektroencefalografii // Voprosy teorii i praktiki elektroencefalografii, 1956].
- Golubeva, E. A. (1963) An attempt to study the reaction of rearrangement of brain biocurrents as an indicator of individual differences in the balance of nervous processes. Typological features of higher nervous activity of a person, Vol. 3 [Golubeva E.A. Popytka issledovaniya reakcii perestroki biotokov mozga kak pokazatelya individual’nyh razlichij po uravnoveshennosti nervnyh processov // Tipologicheskie osobennosti vysshej nervnoj deyatel’nosti cheloveka. 1963. T. III].
- Golubeva, E. A. (1965) Reaction of restructuring of biocurrents of the brain and typological properties of the nervous system. Typological features of higher nervous activity of a person, Vol. 4. [Golubeva E.A. Reakciya perestrojki biotokov mozga i tipologicheskie svojstva nervnoj sistemy // Tipologicheskie osobennosti vysshej nervnoj deyatel’nosti cheloveka. 1965. T. IV].
- Golubeva, E. A., & Schwartz, L. A. (1965). The ratio of bioelectric indicators of lability with critical flicker frequency and the rate of recovery of light sensitivity. Typological features of higher nervous activity of a person, Vol. IV. [Golubeva E.A., Shvarc L.A. Sootnoshenie bioelektricheskih pokazatelej labil’nosti s KCHM i skorost’yu vosstanovleniya svetovoj chuvstvitel’nosti // Tipologicheskie osobennosti vysshej nervnoj deyatel’nosti cheloveka. 1965. T. IV].
- Golubeva, L. Ya. (1959). On the reflection of inhibition in the EEG in animals. Proceedings of the Institute of Higher Nervous Activity of the Academy of Sciences of the USSR, Vol. 3. [Golubeva L.YA. Ob otrazhenii tormozheniya v EEG u zhivotnyh // Trudy Instituta vysshej nervnoj deyatel’nosti AN SSSR. 1959. T. 3].
- Gurevich, K. M. (1965). On the validity of laboratory tests of strength and balance of nervous processes (according to the results of a study of a group of workers from the operational duty personnel of power systems). Typological features of higher nervous activity of a person, Vol. 4 [Gurevich K.M. O validnosti laboratornyh prob sily i balansa nervnyh processov (po rezul’tatam izucheniya gruppy rabotnikov iz operativnogo dezhurnogo personala energosistem) // Tipologicheskie osobennosti vysshej nervnoj deyatel’nosti cheloveka.1965. T. IV].
- Guselnikov, V. I. & Supin, A. Ya. (1962) Some mechanisms of the reaction of “imposing a rhythm”. Physiological journal, 48(4). [Gusel’nikov V.I., Supin A.YA. Nekotorye mekhanizmy reakcii «navyazyvaniya ritma» // Fiziologicheskij zhurnal. 1962. T. 48. № 4].
- Hernandez-Peon, R. (1962). Reticular mechanism of sensory control. Sensory Communication.Y.
- Ilyanok, V. A. (1961). Influence of intensity and depth of flickering light pulsation on the electrical activity of the human brain. Biophysics, 4(1). [Il’yanok V.A. Vliyanie intensivnosti i glubiny pul’sacii mel’kayushchego sveta na elektricheskuyu aktivnost’ mozga cheloveka // Biofizika. 1961. T. VI. Vyp. 1].
- Johnson, L. C. & Ulett, G. A. (1959). Stability of EEG activity and manifest anxiety. Physiological Psychology, V. 52.
- Kaneko, Z., Hidaka, A., Hishikana, A., Shimizu, A., & Miyazaki, K. (1961). Effects of arousal stimulation upon photic driving in the cat. Folia Psychiatrica et Neurologica Japonica, V. 15.
- Khapazhev, T. Sh. (1962). On the relationship between the nature of the electrocorticogram and the magnitude of the excitability of the cerebral cortex during direct electrical stimulation. Bulletin of Leningrad State University, No 15. [Hapazhev T.Sh. O sootnoshenii mezhdu harakterom elektrokortikogrammy i velichinoj vozbudimosti kory golovnogo mozga pri pryamom elektricheskom razdrazhenii // Vestnik LGU. 1962. № 15.]
- Kopylov, A. G. (1956). Evaluation of the functional state of the human brain by the method of electroencephalographic curves of rhythm assimilation. Problems of theory and practice of electroencephalography. [Kopylov A.G. Ocenka funkcional’nogo sostoyaniya golovnogo mozga cheloveka metodom elektroencefalograficheskih krivyh usvoeniya ritma // Voprosy teorii i praktiki elektroencefalografii., 1956.]
- Kopylov, A. G. (1960). Changes in the physiological characteristics of the brain under the influence of drugs and stimulants. Nervous System, No 2. [Kopylov A.G. Izmeneniya fiziologicheskih harakteristik golovnogo mozga pri dejstvii narkotikov i stimulyatorov // Nervnaya sistema. 1960. Vyp. 2].
- Kozhevnikov, V. A. (1954). Method of automatic analysis of biocurrents (electronic analyzer of biocurrents of the brain). Physiological journal, N0 4. [Kozhevnikov V. A. Metod avtomaticheskogo analiza biotokov (elektronnyj analizator biotokov golovnogo mozga) // Fiziologicheskij zhurnal. 1954. № 4].
- Kozhevnikov, V. A. & Soroko, V. I. (1959). Electronic meter of changes in the alpha rhythm of the electroencephalogram arising from the application of irritations. Problems of physiological acoustics, Vol. 4. [Kozhevnikov V.A., Soroko V.I. Elektronnyj izmeritel’ izmenenij al’fa-ritma elektroencefalogrammy, voznikayushchih pri nanesenii razdrazhenij // Problemy fiziologicheskoj akustiki. 1959. T. 4].
- Kreindler, A. (1960). Epilepsy: Clinical and experimental studies. M. [Krejndler A. Epilepsiya: Klinicheskie i eksperimental’nye issledovaniya. M., 1960].
- Lindsley, D. B. (1952). Phychological phenomena and the EEG. Electroencephalography and Clinical Neurophysiology, V. 4.
- Livanov, M. N. (1940). On the uneven development of some frequency processes that make up the electrocerebrogram, and on Berger’s rhythm. Physiological journal, 18(2–3). [Livanov M. N. O neravnomernom razvitii nekotoryh chastotnyh processov, slagayushchih elektrocerebrogrammu, i o ritme Bergera // Fiziologicheskij zhurnal. 1940. T. XVIII. Vyp. 2–3].
- Loomis, A. L., Harvey, E., & Hobart, G. (1936). Electrical potentials of the human brain. Journal of Experimental Psychology, V. 19.
- Mangan, G. L., & Adcock, C. (1962). EEG correlates of perceptual vigilance and defence. Percept. Motor Skills, V. 14.
- Meshchersky, R. M., & Smirnov, G. D. (1961). On the origin of the rhythmic reaction of the cerebral cortex to flashing light. Doklady AN USSR, 139(1). [Meshcherskij R.M., Smirnov G.D. O proiskhozhdenii ritmicheskoj reakcii kory mozga na mel’kayushchij svet // Doklady AN SSSR. 1961. T. 139. № 1].
- Mundy-Castle, A. C. (1953). An analysis of central responses to photic stimulation in normal adults. Electroencephalography and Clinical Neurophysiology, V. 5.
- Mundy-Castle, A. C. (1957). L’electroencephalogramme et sa relation avec le temperament. Conditionnement et reactive en electroencephalographie.
- MсАdаm, W. & Orme, J. E. (1954) Personality traits and the normal electroencephalogram. Merit Research Journal of Medicine and Medical Sciences. V, 100.
- Nebylitsyn, V. D. (1963). Electroencephalographic study of the properties of the strength of the nervous system and the balance of nervous processes in humans using factorial analysis. Typological features of higher nervous activity, V. 3. [Nebylicyn V.D. Elektroencefalograficheskoe izuchenie svojstv sily nervnoj sistemy i uravnoveshennosti nervnyh processov u cheloveka s primeneniem fakto-rial’nogo analiza // Tipologicheskie osobennosti vysshej nervnoj deyatel’nosti. M., 1963. T. III].
- Nebylitsyn, V. D. (1964). Cortico-reticular relations and their place in the structure of the properties of the nervous system. Questions of Psychology, No. 1. [Nebylicyn V. D. Kortiko-retikulyarnye otnosheniya i ih mesto v strukture svojstv nervnoj sistemy // Voprosy psihologii. 1964. № 1].
- Nebylitsyn, V. D. (1964). On the factors of individual differences in the reactions of brain biocurrents to flickering light exposure. Journal of Higher Nervous Activity, 14(2). [Nebylicyn V.D. O faktorah individual’nyh razlichij v reakciyah biotokov mozga na mel’kayushchee svetovoe vozdejstvie // Zhurnal vysshej nervnoj deyatel’nosti. 1964. T. XIV. Vyp. 2].
- Nebylitsyn, V.D. (1965). Dynamism of nervous processes and individual features of the electroencephalogram of rest in humans. Typological features of higher nervous activity in humans. Vol. 4. [Nebylicyn V. D. Dinamichnost’ nervnyh processov i individual’nye osobennosti elektroencefalogrammy pokoya u cheloveka // Tipologicheskie osobennosti vysshej nervnoj deyatel’nosti u cheloveka. 1965. T. IV].
- Nebylitsyn, V. D. (1964). Rhythm imposing reaction as a function of the intensity of a flickering light stimulus. Journal of Higher Nervous Activity, 14(4). [Nebylicyn V.D. Reakciya navyazyvaniya ritma kak funkciya intensivnosti mel’kayushchego svetovogo razdrazhitelya // Zhurnal vysshej nervnoj deyatel’nosti. 1964. T. XIV. Vyp. 4].
- Nelson, G. K. (1960). The measurement and significance of brain rhythms. Transactions of the South African Institute of electrical engineers, V. 51.
- Povorinsky, A. G (1960). Some features of electroencephalogram responses to rhythmic light in normal conditions and in diseases of the central nervous system. Reports of the APS of the RSFSR, No 5. [Povorinskij A.G. Nekotorye osobennosti otvetov elektroencefalogrammy na ritmicheskij svet v norme i pri zabolevaniyah central’noj nervnoj sistemy // Doklady APN RSFSR. 1960. № 5].
- Rabinovich, M. Ya. (1961). Electrophysiological analysis of the activity of various layers of the cerebral cortex during the formation of a conditioned reflex. Journal of Higher Nervous Activity, 11(3). [Rabinovich M.YA. Elektrofiziologicheskij analiz aktivnosti razlichnyh sloev kory bol’shih polusharij pri formirovanii uslovnogo refleksa // Zhurnal vysshej nervnoj deyatel’nosti. 1961. T. XI. № 3].
- Roget, A. (1960). Correlations between the different electroencephalographic variables. Electroencephalography and Clinical Neurophysiology, V. 12.
- Saul, L., Davis, A., & Davis, P. A. (1949). Psychological correlations with the electroen-cephalogram. Electroencephalography and Clinical Neurophysiology, V. 1.
- Shagass C. (1955) Differentiation between anxiety and depression by the photically activated electroencephalogram. American Journal of Psychiatry, V. 112.
- Shpilberg, P. I. (1940). On the human electroencephalogram. Physiological journal, 28(2–3). [Shpil’berg P. I. Ob elektroencefalogramme cheloveka // Fiziologicheskij zhurnal. 1940. T. 28. Vyp. 2–3].
- Supin, A. Ya. (1963). Mechanisms of the reaction of rhythm rearrangement and reflection of the functional state of the cortex in the parameters of this reaction. Electrophysiology of the nervous system. [Supin A.YA. Mekhanizmy reakcii perestrojki ritma i otrazhenie funkcional’nogo sostoyaniya kory v parametrah etoj reakcii // Elektrofiziologiya nervnoj sistemy. 1963.]
- Ulett, G. A., Gteser, G., Winokur, G., & Lawler, A. (1953). The EEG and reaction to photic stimulation as an index of anxiety-proneness. Electroencephalography and Clinical Neurophysiology, V. 5.
- Ulett, G. A., & Johnson, L. C. P. (1958), Stability and correlates of photic-electroencepha-lographic activation. The Journal of Nervous and Mental Disease, V. 126.
- Were, P. F. (1957). The relationships between electroencephalografic and psychological data in normal adults.
- Yoshii, N., Matsumoto, J., Ogura, X., Shimokochi, M., Yamaguchi, V., & Yamasaki, G. (1962). Conditioned reflex and electroencephalography. Electroencephalographic studies of higher nervous activity. [Ioshii N., Macumoto Dzh., Ogura X., SimokoTi M., YAmaguti V., YAmasaki G. Uslovnyj refleks i elektroencefalografiya // Elektroencefalograficheskie issledovaniya vysshej nervnoj deyatel’nosti. M., 1962].
- Yus, A. & Yus, K. (1954). An EEG attempt to analyze the processes of internal inhibition (delay and its transition to sleep). Journal of Neuropathology and Psychiatry, 54(9). [Yus A., Yus K – Popytka EEG analiza processov vnutrennego tormozheniya (zapazdyvaniya i ego perekhoda v son) // Zhurnal nevropatologii i psihiatrii. 1954. T. 54. Vyp. 9].
- Zislina, N. N. (1955). Electrophysiological study of the functional mobility of the brain of children by the method of rhythmic light stimulation. Journal of Higher Nervous Activity, 5(5). [Zislina N.N. Elektrofiziologicheskoe issledovanie funkcional’noj podvizhnosti mozga detej metodom ritmicheskih svetovyh razdrazhenij // Zhurnal vysshej nervnoj deyatel’nosti. 1955. T. V. Vyp. 5].
- Zislina, N. N. & Novikova, L. A. (1962). Investigation of the role of specific and non-specific afferent systems in the reaction of rhythm assimilation. Physiological journal, 48(4). [Zislina N. N., Novikova L. A. Issledovanie roli specificheskoj i nespecificheskoj afferentnyh sistem v reakcii usvoeniya ritma // Fiziologicheskij zhurnal. 1962. T. 48. № 4].
Translated by D. A. Dokuchaev.
References