
A Genetically Informed Test of the Cognitive-Colorism Hypothesis
Abstract
Abstract
In the Americas, less European-looking people have on average worse academic outcomes than more European-looking people. According to the colorism model, these associations between race-related phenotype and academic-related outcomes are due to contemporary phenotypic-based discrimination and not due to family-background or intergenerational factors. Previous studies have attempted to use sibling designs to disentangle the latter two causes from the effects of discrimination. We argue that admixture-regression analysis is an additional helpful tool for disentangling the various causes. Using a large, genetically-informed dataset, we created a genetically-based predictor of European appearance. We tested the hypothesis that European appearance will be associated with academic outcomes independent of genetic ancestry. We also tested the hypothesis that g mediated the relations between ancestry/European appearance and grades. We did not find evidence of this in the case of g (and most cognitive tests), but we did find tentative evidence in the case of parent-reported grades. When genetic ancestry was included in the models, European appearance was not significantly related to g. We also found that while g was a substantial and statistically significant mediator of the association between European ancestry and grades, this was not the case in the context of European appearance and grades. These results are in line with the position that cognitive inequalities in the US are intergenerationally transmitted, and are not the result of contemporaneous color-based discrimination. The admixture-regression method employed here could be applied to different outcomes to test for evidence of phenotypic-based discrimination or, at least, family-background independent effects.
Introduction
In the Americas, research shows that less European-looking and/or darker-looking people are on average less successful than more European-looking and/or lighter-looking people. For example, stereotypically race-related phenotypes, such as skin, hair, and eye color, are generally associated with better socioeconomic outcomes (Hochschild, & Weaver, 2007; Hunter, 2013). Many sociologists attribute this association to phenotypic-based discrimination, also known as “colorism” (e.g., Dixon & Telles, 2017). According to theorists of colorism, phenotypic-based discrimination is common in the Americas, favoring individuals with stereotypical European phenotypes. This discrimination is hypothesized to result in better health, higher occupational and educational attainment, and other more positive outcomes for individuals with a paler or ‘whiter’ appearance; even among those categorized as belonging to the same race/ethnicity, the paler ones will do better than the darker ones (Hochschild & Weaver, 2007; Marira & Mitra, 2013).
Proponents of this colorism model frequently maintain that ‘race’ is a social construct according to which people are arbitrarily categorized based on geographic origins and physical appearance and that modern racial categories have originated primarily based on the work of eighteenth- and nineteenth-century European naturalists and anthropologists (Dixon & Telles, 2017). ‘Color,’ in contrast, is not a social construct but refers to gradations of physical appearance associated with different levels of skin tone (Dixon & Telles, 2017). Theorists of the colorism model place primacy on “the causal role of skin tone in engendering the colorism phenomenon” (Marira & Mitra, 2013, p. 103). Many theorists of colorism argue that other visually conspicuous, stereotypically race-associated traits such as hair color, eye color, hair texture, and facial features may also elicit phenotypic discrimination (Crutchfield et al., 2022; Ryabov, 2013).
In addition to differences in income, health outcomes, and occupational status, colorism has been invoked to explain academic and cognitive differences, including differences in attained years of education, grade point average, and academic/cognitive test scores (Hailu, 2018; Hill, 2002; Kim & Calzada, 2019; Liu et al., 2022; Thompson & McDonald, 2016). In their review, Crutchfield et al. (2022, p. 10) conclude that “lighter skin tones and more Eurocentric features were linked to better academic outcomes, including higher GPAs, additional years of schooling, [and] improved academic performance”.
Concerning specific mechanisms by which individual variability in color could be linked to variation in academic and cognitive outcomes, Thompson and McDonald (2016, p. 6) argue for discrimination, including “direct mechanisms – educational encouragement, evaluation, and provision of learning opportunities – as well as indirect mechanisms – the use of disciplinary actions”. Crutchfield et al. (2022, p. 10) similarly emphasize teacher-student relations as causes, further noting that “darker-skinned students face the greatest barriers to optimal educational outcomes due to differential treatment”. Similarly, Hannon (2014) suggests that adults and educators may have a light-skin-equals-intelligence bias which, in turn, influences both their expectations and their treatment of children of different complexion.
According to theorists of colorism, appearance-based outcome differences directly result from appearance-based discrimination. Ancestry or racial identification matters in so far as “racial classifications are determined more closely by how one phenotypically appears to belong to one race rather than strictly by one’s ancestors” (Hernández, 2015, p. 684), and the same author argues that this is especially true in parts of Latin America. As Hall (2020, p. 79) notes, “in consideration of racism as pertains to colorism, ultimately such biological attributes as ancestry and bloodline may be all but completely irrelevant in the course of discrimination via various acts of colorism”. Making a related point, Harris (2008, p. 61) states that “[t]raditional racism places a higher value on ancestry than colorism… while colorism assigns people to places along a spectrum from dark to light, indigenous or African to European”. Thus, from the perspective of the proponents of colorism, ancestry per se is irrelevant.
If color phenotypes are found to merely proxy the effects of genetic ancestry, the results would be more consistent with what Abascal and Garcia (2022) describe as the inherited (dis)advantage model or what Hu et al. (2019) name the distributional model, and which we consider essentially the same model. According to this model, for various reasons, populations differ in traits, and these trait differences are transmitted vertically or intergenerationally. Because both racial appearance/color and family heritage, including ancestry, correlate in ancestrally heterogeneous populations, there is potential confounding between ancestry-related family influences and discrimination conditioned on color phenotypes.
Due to a concern for confounding, some research has attempted to control for intergenerational factors by employing sibling designs and measuring academic or educational outcomes (Bucca, 2018; Francis-Tan, 2016; Francis & Tannuri-Pianto, 2012; Hu et al.,2019; Kizer, 2017; Marteleto & Dondero, 2016; Mill & Stein, 2016; Rangel, 2015; Ryaboy, 2016; Telles, 2004). The reasoning is that in recently-admixed populations, siblings may differ noticeably in race-associated phenotypes such as skin color (see: e.g., Leite et al., 2011), but siblings will exhibit little differences in genetic ancestry and no difference in family environment. As a result, with a sibling design, it should be possible to disentangle appearance-based effects from family-heritage-based ones. The academic outcome differences examined in these studies include the following variables: educational attainment (Buca, 2018; Francis-Tan, 2016; Kizer, 2017; Marteleto & Dondero, 2016; Mill & Stein, 2016; Rangel, 2015; Ryaboy, 2016), grade-point average (Francis & Tannuri-Pianto, 2012), age-appropriate grade (Telles, 2004), aptitude test scores (Francis & Tannuri-Pianto, 2012; Hu et al.,2019), and literacy (Mill & Stein, 2016).
Most researchers either found modest associations between color phenotype and academic outcomes among siblings and interpreted their results as mainly supporting an intergenerational model (Francis-Tan, 2016; Mill & Stein, 2016; Rangel, 2015) or reported slight within-sibship differences but interpreted these as support for some color-based discrimination (Telles, 2004). However, a minority of researchers reported substantial and statistically significant within-sibship effects (Marteleto & Dondero, 2016; Ryabov, 2016). Although no formal meta-analysis has been conducted, carefully studying all the outcomes shows a relatively small overall within-sibships effect. The results from the eight sibling studies involving academic outcomes are reviewed in Table 15 of the supplementary file. As seen in 16 out of 20 effects, darker siblings have on average worse academic outcomes, and the mean effect between siblings is about 10% of the effect, unconditioned on family background, among families or in the population. These analyses, though, have been limited by the modest number of variables available in the case of the census-based studies (e.g., Francis-Tan, 2016; Mill & Stein, 2016; Rangel, 2015; Telles, 2004) or non-optimal statistical power in the case of the longitudinal studies (e.g., Buca, 2018; Hu et al., 2019; Kizer, 2017).
An alternative approach to testing colorism vs. inheritance hypotheses involves using admixture-regression designs (e.g., Connor & Fuerst, 2023; Fuerst, 2021; Fuerst et al., 2021). In these designs, recently-admixed populations are treated as natural experiments, and this admixture is used to disentangle various cultural, environmental, and genetic factors. In the present context, the design is employed to try to disentangle inherited (dis)advantages associated with racial appearance from non-inherited (dis)advantages due to, for example, contemporaneous discrimination. For this purpose, global genetic ancestry and either a phenotype or genetic markers of a phenotype are included in a regression analysis along with other variables. The objective is to determine whether racial appearance affects outcomes independent of global genetic ancestry.
A theoretical path model is presented in Figure 1. The colorism model posits that discrimination based on phenotype results in disparities in cognitive abilities and
other academic outcomes through the direct effects of discrimination on learning. According to this model, in populations with a mix of ancestries, academic performance is likely indirectly linked to genetic ancestry due to the correlation between racial phenotypes and genetics. Conversely, the inherited disadvantage model argues that genetic and cultural factors, which are tied to global ancestry, drive academic outcome disparities. Because genetic ancestry is correlated with racial phenotypes, academic related traits will tend to be indirectly correlated with racial phenotype in admixed populations. In the admixture-regression design, global genetic ancestry is controlled for to account for inherited disadvantages.
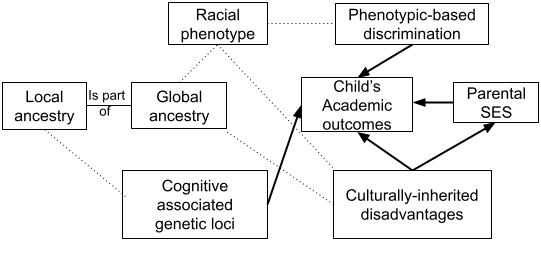
Figure 1. Theoretical Model of the Association between Putative Causes (Discrimination vs. Inherited Disadvantage), Ancestry, Racial-Phenotype, Academic Outcomes, and Parental-Socioeconomic Status.
The colorism model clearly predicts that racial appearance affects outcomes independent of genetic ancestry. If the model is correct, individuals with lighter skin, hair, and eye color should have better outcomes controlling for overall genetic ancestry. An opposite finding would be consistent with an intergenerational model, according to which traits conducive to better outcomes are being transmitted down lines of descent as indexed by genetic ancestry. This inheritance of traits could be mediated by genes, epigenetic factors, or culturally-inherited factors. Applying the admixture-regression design to data from the US and Brazil suggests that educational attainment and cognitive ability are primarily related to genetic ancestry, and are mostly unrelated to racial appearance (Fuerst et al., 2021; Kirkegaard et al., 2017; Lasker et al., 2019).
The admixture-regression design comes with a couple of assumptions that can be easily tested. The first assumption is that there is little cross-assortative mating for race-associated phenotype and the relevant traits (e.g., cognitive ability). In the presence of such assortment, race-associated phenotype can become genetically correlated with the outcomes independent of ancestry (Jensen, 1998). If so, race-associated phenotype and outcomes may be associated with one another, independent of ancestry, for genetic and not discriminatory reasons. The second assumption is that there is no substantial reverse causation from outcomes to race-associated phenotype; for example, low-prestige occupations often are associated with increased outdoor work, sun exposure, and, consequently, darker color. These two assumptions are common to colorism research, but, in this design, they only become a concern if an association between race-associated phenotype and outcomes is found independent of genetic ancestry.
The third assumption is that genetic ancestry and racial appearance are not collinear in samples. Dissociation between race-associated traits, especially non-highly polygenic ones, and genetic ancestry is expected in admixed populations due to genetic crossover and segregation (Kim et al., 2021). The extent of dissociation is an empirical question. The final assumption is that inherited (dis)advantages correspond with differences in ancestry. This is expected based on a simple model of vertical transmission of inherited traits given an initial inequality between groups and assuming that the estimated ancestry corresponds with the percentage of ancestors of relevant parental groups. In admixed American groups this assumption holds, because genetic ancestry percentages can be understood in terms of the number of ancestors from different ancestry groups (e.g., Mooney et al., 2022).
Most studies on the effects of racial appearance use single phenotypic measures of appearance. However, interviewer-rated color scales, in particular, have often been found to have modest reliability (Campbell et al., 2020; Hannon & DeFina, 2016; Hannon & DeFina, 2020). Moreover, skin color ratings have been found to be influenced by interviewer-related characteristics (Campbell et al., 2020; Cernat et al., 2019) and, additionally, the interviewer’s perceptions about the participants’ socioeconomic status (Roth et al., 2022). So, there are some concerns about the reliability and validity of skin color ratings. An alternative approach is to use genetic predictors of phenotype; they have an advantage in that they do not suffer from the problems of reverse causality and interviewer-related biases. Therefore, in this study, we created several new genetically-based predictors of European appearance. Moreover, we combine these predictors of skin, hair, and eye color through factor analysis to increase reliability. Afterward, we conducted admixture-regression analyses to test if European appearance was associated with general intelligence (g) and school grades independently of global genetic ancestry, as predicted by theorists of colorism. Cognitive ability was of particular interest because it has been found to partially mediate the relation between color and other outcomes (Campos-Vazquez & Medina-Cortina, 2019; Fuerst et al., 2019; Kreisman & Rangel, 2015). Therefore, cognitive ability differences may partially explain the relationship between color and socioeconomic or academic outcome differences. For this reason, Huddleston and Montgomery (2010, p. 69) note that “more research is needed in intragroup differences among Blacks and intelligence… Results from this research have huge implications for the skin tone hierarchy in the African American community”. In line with this recommendation, we examine the extent to which cognitive ability plays a mediating role for genetic ancestry and grades.
As we already noted, studies which have used sibling designs overall show a modest association between European appearance and academic outcomes. Based on these results, we hypothesized that European appearance will show an association with both g and grades in regression models which also include genetic ancestry. Moreover, meta-analyses indicate that general mental ability and school grades are highly correlated (e.g., Roth et al., 2015), so we hypothesized that the relation between both European appearance and genetic ancestry and between school grades will be strongly mediated by g.
Method
2.1. Sample
The Adolescent Brain Cognitive Development Study (ABCD) is a collaborative longitudinal project involving 21 collection sites across the US. It was created to research the psychological and neurobiological bases of human development. At baseline, around 11,000 9-10-year-old children were sampled, mostly from public and private elementary schools. A probabilistic sampling strategy was used to create a broadly representative sample of the population for this age group. We used the 3.0 data release.
For the main analyses, we focused on the 3814 (with grades) to 4459 (with g scores) individuals who were parentally identified as Black, Hispanic, Native American, or Other; we also included individuals who were marked as belonging to multiple race/ethnic categories. The choice to focus on these ethnic groups was influenced by Marira and Mitra (2013), who note that “the most rigorous research concerning the nexus of colorism and labor market outcomes has been conducted on African American and Latino populations in the United States” (p. 104). Although there is little ancestry-related color variability among non-Hispanic White Americans, we also ran the analyses including this group; we relegated most of these results to the supplementary file. We excluded anyone who was parentally identified as East Asian, South Asian, or Pacific Islander primarily because there were potential problems with reliable and interpretable East and South Asian ancestry estimates. Among South Asians, admixture estimates capture both recent and archaic Indo-European admixture, rendering the interpretation of these estimates unclear. Moreover, since we were unable to create a separate Pacific Islander ancestry component due to a lack of reference samples, East Asian and Pacific Islander ancestry was confounded. In contrast, the interpretation of European, African, and Amerindian admixture among Black, Hispanic, and Native American populations is unambiguous since this admixture occurred within the last 500 years, following the Age of Discovery and the settling of the New World.
2.2. Variables
A number of theoretically relevant variables were used. They are described in the sections below.
2.2.1 Admixture estimates
The ABCD Research Consortium conducted the imputing and genotyping using Illumina XX. Quality control was performed using PLINK 1.9; a total of 516,598 genetic variants survived the quality control. When computing admixture estimates, we used only directly genotyped, bi-allelic, autosomal SNP variants (494,433 before, 493,196 after lifting). We filtered variants in the reference population dataset to reduce bias from sample non-representativeness. Variants were pruned for linkage disequilibrium at the 0.1 R² level using PLINK 1.9 (–indep-pairwise 10000 100 0.1), leaving 99,642 variants after pruning. Next, target samples from ABCD were merged with reference population data from 1000 Genomes and HapMap. We excluded the following 1000 Genomes and HGDP reference populations: Adygei, Balochi, Bedouin, Bougainville, Brahui, Burusho, Druze, Hazara, Makrani, Mozabite, Palestinian, Papuan, San, Sindhi, Uygur, and Yakut. These populations were excluded because either they were overly admixed or because the individuals in the ABCD sample lacked significant portions of these ancestries (as in the case of Melanesians and San). The ABCD target sample was then split into 50 random subsets (of approximately 222 persons each) and merged sequentially with the reference data. Repeat subsetting was done to avoid skewing the admixture algorithm to European ancestry, as this ancestry was dominant in the ABCD sample. Next, we performed cluster analysis and estimated ancestry based on a k = 5 solution (European, Amerindian, African, East Asian, and South Asian ancestries), as this provided the most comprehensive yet also parsimonious model of the US population and captured all predominant ancestral backgrounds in the US population. Our European, African, and Amerindian estimates perfectly correlated with the estimates provided in the ABCD dataset (genetic_af_european, genetic_af_african, and genetic_af_european). As ABCD does not clearly document the construction of these estimates, we used our own ancestry estimates instead.
2.2.2. General cognitive ability, 11 cognitive tests, and NIHTBX fluid and crystal composite scores
The baseline ABCD data contained the following cognitive tests: Picture Vocabulary, Flanker, List Sorting, Card Sorting, Pattern Comparison, Picture Sequence Memory, Oral Reading Recognition, Wechsler Intelligence Scale for Children’s Matrix Reasoning, the Little Man Test (efficiency score), the Rey Auditory Verbal Learning Test (RAVLT) immediate recall, and RAVLT delayed recall. The first seven of these are from the NIH Toolbox® cognitive battery. For details about these measures, see Thompson et al. (2019). In addition, ABCD provides a precomputed measure of crystallized cognitive ability (based on the Picture Vocabulary Test and the Oral Reading Recognition Test) and a measure of fluid cognitive ability (based on Flanker, List Sorting, Card Sorting, Pattern Comparison, and Picture Sequence Memory) measures. Details of these measures are provided by Akshoomoff et al. (2014). The crystallized ability subtests are said to be more dependent on learning experience and “represent accumulated store of verbal knowledge and skills, and thus are more heavily influenced by education and cultural exposure, particularly during childhood” (Akshoomoff, 2014, p. 120).
We computed g scores via the multi-group confirmatory factor-analytic method detailed in Fuerst et al. (2021). In this earlier publication, we outputted the g scores from the best-fitting and, additionally most-parsimonious model. In this case, g alone was found to explain the mean parentally-identified race and ethnicity (henceforth ‘race and ethnicity’) differences. Scores were standardized (M = 0.00; SD = 1.00) on the total sample of 10,370 children.
2.2.3. Grades
Parents were asked: “What kind of grades does your child get on average?” (1 = As /2 = Bs /3 = Cs / 4 = Ds / 5 = Fs). We recoded this variable using a 4-point scale as is commonly used in the US (with 4.0 representing an A, 3.0 representing a B, etc.), and then standardized the scores (M = 0.00; SD = 1.00). These data were available for N = 9128 for the Black-Hispanic-Other-White sample and N = 3814 for the Black-Hispanic-Other sample.
2.2.4. Child US-born and immigrant family
Parents reported if the child was born in the United States. This variable is recoded as “1” if the child was born in the United States and “0” for all other responses. Additionally, parents reported if any family members (including the child’s maternal or paternal grandparents) were born outside of the United States. This variable, immigrant family, was also recoded as “1” if any family member was born outside the United States and “0” for all other responses.
2.2.5. Sex
Parents identified the sex of the children as female or male. Sex was recoded as “1” for females, and “0” for males.
2.2.6. Age
Age was calculated starting with age in months at the time of the interview (“interview age”) divided by 12.
2.2.7. General socioeconomic status (SES)
Using Principal Components Analysis (PCA), we computed a general factor of SES based on seven substantially correlated indicators, which explained 42% of the variance. The loadings on the first factor were: financial adversity (.31), area deprivation index (.49), neighborhood safety protocol (.31), parental education (.54), parental income (.66), parental marital status (.43), and parental employment status (.23). We used the PCA mixdata R package (Chavent et al., 2014) to analyze these data, since this algorithm handles mixed categorical and continuous data. Fuerst et al. (2021) provide more details on this variable.
2.2.8. Predicted European appearance
As interviewer-rated phenotype is often unreliable and influenced by interviewer characteristics and as we only had phenotypic data for a small subset of the sample, we created genetic predictors of phenotype for analysis of the main sample. Specifically, we used tanning ability and hair pigment polyfun scores from Weissbrod et al. (2022; note that the SNP weights for these phenotypes were first published at the beginning of 2020) and skin color, hair color, and eye color probabilities calculated using the HIrisPlex-S web application (https://hirisplex.erasmusmc.nl/). To create a genetic index of European appearance, we employed PGSs developed by Weissbrod et al. (2020; 2022) for tanning propensity and hair pigment. These were created by applying genome-wide functionally-informed fine-mapping to individuals of British descent in the UK Biobank. These scores likely better estimate causal effects, thus reducing the likely adverse effects on between-population portability stemming from the impacts of linkage phase disequilibrium differences between populations (Weissbrod et al., 2020; Weissbrod et al., 2022).
The HIrisPlex-S web application, developed for use by the US Department of Justice in forensic investigations, and validated on thousands of people from around the world (Chaitanya et al., 2018; Walsh et al., 2017; Walsh et al., 2014), imputes probabilities for skin, hair, and eye color based on 41 SNPs that are functionally related to what could broadly be termed color traits (of these 36 were for skincolor, 22 for hair color, and six for eyecolor, with overlap). HIrisPlex-S gives probabilities that a given individual occupies a level associated with the Fitzpatrick Scale skin type (i.e., Type I, scores 0–6, “palest, freckles”; Type II, scores 7–13; Type III-IV (combined), scores 14–27; Type V, scores 28–34; Type VI, scores 35–36, this being associated with “deeply pigmented dark brown to darkest brown”). We weighted the medium score of each Type (e.g., Type I = 3) by the probability of each type to create a singular color measure. For hair color, HIrisPlex-S gives probabilities of light as opposed to dark hair color. For eye color, HIrisPlex-S gives probabilities of blue, intermediate, and dark eye color. We summed the blue and intermediate colors to create the light eye color probability.
The five phenotypic predictor scores, all based on functionally-informed SNPs, overlapped due to pleiotropy, meaning that different traits are co-influenced by a common set of genes. Because of these pleiotropic relationships, we were able to use factor analysis, yielding summary scores. Specifically, we factor-analyzed the tanning ability, hair pigment, skin color, hair color, and eye color scores, using the built-in R command factanal. This command function fits a common factor model using maximum likelihood estimation. A single-factor model explained 81% of the variance, and the loadings were: tanning ability .96, hair pigment .98, skin color .89, hair color .88, and eye color .79. We centered and standardized these scores in the full sample of 10,370 children. The correlation matrices are shown in Table 1.
Table 1. Correlation matrices for European genetic ancestry, predicted European appearance, and genetically predicted hair, skin, and hair color scores.
a. Black-Hispanic-Other sample (N =4459)
| Variable | M | SD | 1 | 2 | 3 | 4 | 5 | 6 | |||||||
| 1. European ancestry | 0.44 | 0.28 | |||||||||||||
| 2. European appearance | -0.89 | 0.79 | .84** | ||||||||||||
| [.83, .85] | |||||||||||||||
| 3. UKBB tanning ability | -0.85 | 0.87 | .85** | .95** | |||||||||||
| [.84, .86] | [.95, .96] | ||||||||||||||
| 4.UKBB hair pigment | -0.88 | 0.80 | .82** | .99** | .92** | ||||||||||
| [.81, .83] | [.99, .99] | [.92, .92] | |||||||||||||
| 5. HirisPlex
skin color |
-0.82 | 0.81 | .67** | .82** | .78** | .77** | |||||||||
| [.66, .69] | [.81, .83] | [.76, .79] | [.76, .79] | ||||||||||||
| 6. HirisPlex hair color | 0.21 | 0.29 | .64** | .84** | .75** | .80** | .71** | ||||||||
| [.62, .66] | [.83, .84] | [.73, .76] | [.79, .81] | [.69, .72] | |||||||||||
| 7. HirisPlex eye color | 0.13 | 0.26 | .52** | .71** | .59** | .68** | .63** | .73** | |||||||
| [.50, .54] | [.69, .72] | [.57, .61] | [.67, .70] | [.61, .65] | [.71, .74] | ||||||||||
b. Black-Hispanic-Other-White sample (N =10,370)
| Variable | M | SD | 1 | 2 | 3 | 4 | 5 | 6 |
| 1. European ancestry | 0.75 | 0.33 | ||||||
| 2. European Appearance | 0.00 | 1.00 | .89** | |||||
| [.89, .89] | ||||||||
| 3. UKBB tanning ability | 0.00 | 1.00 | .89** | .97** | ||||
| [.89, .89] | [.96, .97] | |||||||
| 4. UKBB hair pigment | 0.00 | 1.00 | .88** | .99** | .94** | |||
| [.88, .89] | [.99, .99] | [.94, .95] | ||||||
| 5. HirisPlex skin color | 0.00 | 1.00 | .80** | .90** | .87** | .87** | ||
| [.79, .80] | [.89, .90] | [.87, .88] | [.86, .87] | |||||
| 6. HirisPlex hair color | 0.53 | 0.39 | .77** | .89** | .82** | .87** | .77** | |
| [.76, .78] | [.89, .89] | [.82, .83] | [.86, .87] | [.77, .78] | ||||
| 7. HirisPlex eye color | 0.44 | 0.41 | .66** | .80** | .70** | .78** | .74** | .79** |
| [.65, .67] | [.79, .80] | [.69, .71] | [.77, .79] | [.73, .75] | [.79, .80] |
Note. M and SD are used to represent mean and standard deviation, respectively. Values in square brackets indicate the 95% confidence interval for each correlation. The confidence interval is a plausible range of population correlations that could have caused the sample correlation. * indicates p < .05. ** indicates p < .01.
2.2.9. European Phenotype
The ABCD twin data contained race-related phenotypic ratings for N = 239 individuals (after removing one MZ twin from each MZ twin pair). There were two ordinal-scale ratings for each phenotype. The phenotypes were as follows:
(1) Hair color (“zyg_ss_t1_hair_dark”; “zyg_ss_t2_hair_dark”) which was rated
as “0” = light, “1” = medium, “2” = dark, and which we reverse-coded.
(2) Hair pigment (“zyg_ss_t1_hair_col”; “zyg_ss_t2_hair_col”) which was rated as “0” = light blond, “1” = blond, “2” = red, “3” = brown, “4” = black, and which we reverse-coded.
(3) Eye color (“zyg_ss_t1_eye_col”; “zyg_ss_t2_eye_col”); this scale was originally rated as “0” = blue, “1” = gray, “2” = green, “3” = hazel, “4” = brown, and we recoded this scale as follows: light (blue, grey, and green) = “1” and dark (hazel & brown) = “0”.
(4) Hair form, based on the sum of scores from hair texture (“zyg_ss_t1_hair_txtr”; “zyg_ss_t2_hair_txtr”), which was rated as “0” = coarse, “1” = medium, “2” = fine, and hair type (“zyg_ss_t1_hair_type”; “zyg_ss_t2_hair_type”) which was rated as “0” = curly, and “1” = wavy, “2” = straight.
Higher values were associated with a more typical European hair form.
Since we had data from two raters, we were able to compute reliability estimates. Internal consistency coefficients (ICC) estimates and their 95% confidence –
intervals were calculated using the Psych statistical package (Revelle & Revelle, 2015). These values were based on a mean rating (k = 2), absolute-agreement, one-way random model (i.e., ICC1k; Koo & Li, 2016). The one-way model used phenotypic data sourced from two data collection sites (02 and 19). The one-way model is recommended in cases such as these (Koo & Li, 2016). Hair color, hair pigment, eye color, and hair form had average reliabilities [and confidence intervals] of .67 [.59, .73], .68 [.82, .88], 84 [.80, .87], and .89 [.86, .91], respectively. These values indicate moderate to good reliability (Koo & Li, 2016), so we used the average of ratings in subsequent analyses. Moreover, the four phenotype scores were strongly correlated with European ancestry (rs = .44 to .57); the correlation matrices are shown in Table 2.
To create rated-European phenotype scores, we factor-analyzed the scores using the R command factanal. A single-factor model explained 35% of the variance, and the loadings were as follows: hair color .46, hair pigment .74, eye color .71, and hair form .36. We centered and standardized these scores on the subsample of 239 individuals with phenotypic data.
Table 2. Correlation matrices for European genetic ancestry, genetically predicting European appearance, phenotypic European appearance, and specific phenotypes in the twin sample with phenotypic ratings (N = 239).
| Variable | M | SD | 1 | 2 | 3 | 4 | 5 | 6 |
| 1. European ancestry
|
0.85 | 0.21 | ||||||
| 2. Predicted
European appearance |
0.00 | 1.00 | .79** | |||||
| 3. Phenotypic
European appearance |
0.00 | 1.00 | .71** | .76** | ||||
|
4. Phenotype: light hair |
0.00 | 1,00 | .44** | .48** | .54** | |||
|
5. Phenotype: hair pigment |
0.00 | 1.00 | .56** | .61** | .87** | .34** | ||
|
6. Phenotype: light eyes |
0.00 | 1.00 | .57** | .64** | .83** | .32** | .53** | |
|
7. Phenotype: fine hair form |
0.00 | 1.00 | .53** | .43** | .43** | .21** | .26** | .25** |
Note. M and SD are used to represent mean and standard deviation, respectively. * indicates p < .05. ** indicates p < .01. N = 239.
The correlation between our genetically predicted European appearance and rated European phenotype was r = .76, which can be regarded as high-magnitude (Gignac & Szodorai, 2016). Notably this correlation was higher than that with global ancestry at r = .71, as would be expected if our variable predicted physical appearance above and beyond genetic ancestry. The ICCs for genetically predicted European appearance and rated European phenotype (N = 239) were .80 and .89 for single and average raters, respectively. For the Black-Hispanic-Other subsample (N = 88), these ICCs were .75 and .86, respectively. These magnitudes are usually interpreted to mean good reliability (Koo & Li, 2016).
2.2.10. Race and ethnicity fraction and Hispanic
Based on the 18 questions asking about the child’s race, we created four dummy race and ethnicity variables: Black, White, Native American, and Not Otherwise Classified (NOC).
The NOC category included those identified as “Other Race,” “Refused to answer,” or “Don’t Know”. Asians and Pacific Islanders were previously excluded and so were not included in the NOC category. We transformed these variables into interval race and ethnicity variables. These were calculated as the value selected for each of the four groups (0 or 1) over the total number of responses (0 to 4). Thus, individuals were assigned four race and ethnicity fractions ranging from 0 to 1. We used the White interval variable as the benchmark group. As a result, this variable is dropped from the regression models. As with ancestry, we leave these variables unstandardized so that the unstandardized beta coefficients for race and ethnicity fraction can be interpreted as a change in 100 percent race and ethnicity identity for every standardized unit of the dependent variable. We further create a variable for Hispanic ethnicity, coded as “1” for “Hispanic” and “0” for non-Hispanic. The correlation matrices for the predicted European appearance, genetic ancestry, and race and ethnicity variables, based on the Black-Hispanic-Other-White sample, are shown in Table 3.
Table 3. Correlation matrices for predicted European appearance, genetic ancestry, and race and ethnicity in the Black-Hispanic-Other-White sample (N = 10,370).
| Variable | M | SD | 1 | 2 | 3 | 4 | 5 | 6 | 7 | 8 |
| 1. Predicted European appearance | 0.00 | 1.00 | ||||||||
| 2. European ancestry | 0.75 | 0.33 | .89** | |||||||
| 3. African ancestry | 0.18 | 0.31 | -.78** | -.89** | ||||||
| 4. Amerindian
ancestry |
0.06 | 0.14 | -.32** | -.31** | -.13** | |||||
| 5. frac White | 0.73 | 0.43 | .77** | .86** | -.83** | -.13** | ||||
| 6. frac Black | 0.20 | 0.38 | -.72** | -.83** | .95** | -.17** | -.82** | |||
| 7. frac Native
American |
0.02 | 0.11 | -.03** | -.03** | -0.01 | .08** | -.18** | -.05** | ||
| 8. frac NOC | 0.06 | 0.23 | -.21** | -.19** | -.03** | .49** | -.41** | -.13** | -.04** | |
| 9. Hispanic | 0.19 | 0.40 | -.27** | -.22** | -.12** | .76** | -.07** | -.17** | .04** | .38** |
Note. M and SD are used to represent mean and standard deviation, respectively. * indicates p < .05. ** indicates p < .01.
2.2.11. eduPGS
To create educational polygenic scores (PGS), we scored the genomes using PLINK v1.90b6.8. We used the multi-trait analysis of genome-wide association study (MTAG) eduPGS SNPs (N = 8,898 variants in this sample) to compute eduPGS, and we based ourselves on the results from the genome-wide association study (GWAS) of Lee et al. (2018). These scores were based on educational attainment (N = 1,131,881), cognitive ability (N = 257,841), hardest math class taken (N = 430,445), and mathematical ability (N = 564,698) (Lee et al., 2018). Previous research has shown these scores to have good predictive validity in European populations, and reasonable trans-ethnic predictive validity in Hispanic, and African-American populations (Fuerst et al., 2021; Lasker et al., 2019).
2.3. Analysis
2.3.1 Validation of European Phenotypic Predictor
To validate our genetic predictor of European appearance, we ran two analyses. First, we ran regression models in which we predicted parentally-identified-child-racial category (White = “1”; non-White = “0”) based on our European phenotypic predictor, with European genetic ancestry controlled. While racial classifications in the US are primarily based on perceived continental ancestry (Harris, 2008; Hall, 2020), skin color has been found to influence the classifications independently of ancestry (Schachter, Flores & Maghbouleh, 2021). Thus, we expected European appearance to predict the identified race of the child, independently of genetic ancestry.
In line with the recommendation of Heeringa and Berglund (2021), we used a linear mixed-effects model rather than ordinary least squares. Linear mixed-effects involve partially decomposing the residual term into linear random effects components linked to the data-collection-site identifiers and same-family identifiers within the sample. This allows for the possibility of error term correlations within data collection sites or within families with multiple tested individuals (see: Heeringa & Berglund, 2021). This specification replicates that which was used by the ABCD Data Exploration and Analysis Portal (DEAP), and so the use of this multilevel model also aids in replication. To run these analyses, we employed the lmer command from the
lme4 package (Bates, Mächler, Bolker, & Walker, 2015).
As noted in Section 2.2.9 our European phenotype predictor had excellent reliability. So, second, using the subsample for which we had phenotypic ratings, we examine the degree to which our genetically predicted European appearance variable predicted rated European phenotype independently of genetic ancestry and, in supplemental analyses, race and ethnicity. We expect our appearance predictor to have validity as a predictor of rater reported appearance above and beyond global genetic ancestry. Since, we only had two sample sites and since we dropped one of two MZ twins we ran ordinary least square (OLS) for simplicity. However, we also report results based on linear mixed-effects, controlling for site, in Tab 2 of the supplementary file.
2.3.2 Main regression analyses
We next ran a series of regression analyses, using mixed-effects models, in which g or parentally-reported grades was the dependent variable and European appearance was the main independent variable. We ran five models, which sequentially added (parentally-identified) racial and ethnic category, SES, and ancestry, and both ancestry and SES to the initial regression model. The expectation was that if the colorism model was correct, predicted European appearance would retain validity when we added race and ethnicity, SES, and ancestry. In running these models, we followed a methodology similar to that of Telles and Paschel (2014) and Telles, Flores, and Urrea-Giraldo (2015), except that we also added genetic ancestry to the models. So, we followed established models of analyzing these kinds of data.
For the analyses with g (and also cognitive subtests), we used the mixed-effects model discussed above. However, parent-reported school grades showed a strong censoring effect (A = 49%; B = 36%; C to F = 15%), with many individuals receiving the highest grade of an A and the distribution not being normal. Therefore, we also ran analyses for grades using tobit regression, which adjusts for censored data, since censoring can induce effects resembling model misspecification. For these analyses, we used the tobit function in the AER package (Kleiber et al., 2020). No package for multilevel tobit regression is available for R, so for these tobit regression analyses we dropped the site and family random effects and included dummy variables for recruitment site instead. This is a suboptimal method, so we ran all analyses using both the standard mixed-effects model based on linear regression and the tobit regression models and compared the results. We also assessed the degree of collinearity for the European appearance variable, using the variance inflation factor (VIF) statistic. We used the car statistical package (Fox and Weisberg, 2011) to calculate the values of VIF.
2.3.3 Causal mediation analyses
Following the suggestion of Huddleston and Montgomery (2010), we ran causal mediation analysis using the mediation R package (Tingley et al., 2013). This package estimates both the mediation effect and the proportion of the effect that is directly causally mediated. We ran analyses with g as a mediator of the relation between grades and either European ancestry or European appearance. We ran these analyses both in the Black-Hispanic-Other-White sample and the Black-Hispanic-Other sample. European ancestry, European appearance, sex, age, child US-born, immigrant family, race and ethnicity, and interview site are included as covariates in all of the mediation analyses. Since this package cannot handle two levels of random effects, we dropped the family level from the analyses when using the mixed-effects model. We alternatively ran the models using linear regression for g and tobit regression for grades, in which case site effects were included as dummy variables.
2.3.4 Robustness analyses
Finally, as a robustness check, we reran the main regression analyses using the UKBB tanning and the HIrisPlex skin color variables instead of European appearance. This was done because theorists of colorism put the causal role of skin-color-based discrimination central (Marira & Mitra, 2013), and it may be that our European appearance variable is obscuring the relation between skin color and academic outcomes by also taking into account hair and eye color. We also reran the main analyses on the Hispanic and Black subsamples independently to determine if effects were present in subgroups. This was done because researchers using sibling designs have reported significant appearance-related effects among Hispanics (Ryaboy, 2016) without these effects being present in the full sample (Kizer, 2017). It may be that there are appearance-related effects among Hispanics or Blacks but not in the combined sample.
Additionally, we ran the analyses on all eleven cognitive subtests used to create g scores, and the NIH toolbox crystallized and fluid ability scales since it is possible that discriminatory effects will be localized on certain measures of cognitive ability. Differences might be expected to be more pronounced on crystallized measures since crystallized intelligence is “more heavily influenced by education and cultural exposure” (Akshoomoff, 2014, p. 120) and since theorists of colorism argue that colorism will manifest as a barrier to learning opportunities.
We further tested for possible cross-trait assortative mating by examining if eduPGS scores predict European appearance, tanning, and color independent of European ancestry. If there was cross-trait assortative mating, we would expect a substantial effect of eduPGS on these traits independent of European genetic ancestry. Norris (2019) reports polygenic evidence of assortative mating for education among Latin-American populations, while Zou et al. (2015) report evidence of assortative mating on European appearance. So, it is plausible that there was simultaneous assortative mating on both European appearance and education. While generally not mentioned by theorists of colorism, cross-trait assortative mating has long been hypothesized to explain advantages associated with European appearance in admixed American populations (e.g., Jensen, 1998; Reuter, 1917; Valenzuela, 2011).
2.4. Data and code
The R-code and additional model outputs are included in the supplementary file, available at Open Science Frame: https://osf.io/jqkns/. ABCD data are available to qualified researchers at: https://nda.nih.gov/abcd.
Results
3.1. Validation
Table 4 shows the regression results for predicting White racial and ethnic categorization. Model 1 shows the results for the Black-Hispanic-Other sample, while Model 2 shows the results for the Black-Hispanic-Other-White sample. Model 1a and Model 2a include only European ancestry as the predictor, while Model 1b and Model 2b include all non-European ancestries as predictors. We note that our genetically-predicted European appearance variable predicts participant race and ethnicity independently of genetic ancestry. The effect is small, as expected, because race and ethnicity in the US are mostly understood in terms of ancestry.
Table 4. Regression models with genetically-predicted European appearance as the key independent variable and white racial and ethnic categorization as the dependent variable using the Black-Hispanic-Other sample (Model 1) and the Black-Hispanic-Other-White sample (Model 2).
| Model 1a:
Race/ethnicity, Appearance, & European Ancestry |
Model 1b:
Race/ethnicity, Appearance, & non-European Ancestries |
Model 2a:
Race/ethnicity, Appearance, & European Ancestry |
Model 2b:
Race/ethnicity, Appearance, & non-European Ancestries |
|||||||
| Predictors | b | P | b | P | b | P | b | P | ||
| (Intercept) | -0.10 | 0.005 | 0.76 | <0.001 | -0.14 | <0.001 | 0.94 | <0.001 | ||
| (0.04) | (0.03) | (0.02) | (0.02) | |||||||
| Predicted European appearance | 0.03 | 0.004 | 0.02 | 0.017 | 0.02 | <0.001 | 0.02 | <0.001 | ||
| (0.01) | (0.01) | (0.00) | (0.00) | |||||||
| European ancestry | 0.88 | <0.001 | 1.07 | <0.001 | ||||||
| (0.03) | (0.01) | |||||||||
| Child
US Born |
0.04 | 0.071 | 0.04 | 0.124 | 0.05 | 0.001 | 0.04 | 0.003 | ||
| (0.02) | (0.02) | (0.01) | (0.01) | |||||||
| Immigrant Family | 0.14 | <0.001 | 0.06 | <0.001 | 0.07 | <0.001 | 0.02 | <0.001 | ||
| (0.01) | (0.01) | (0.01) | (0.01) | |||||||
| African ancestry | -0.92 | <0.001 | -1.13 | <0.001 | ||||||
| (0.03) | (0.01) | |||||||||
| Amerindian ancestry | -0.35 | <0.001 | -0.67 | <0.001 | ||||||
| (0.04) | (0.02) | |||||||||
| East Asian ancestry | -0.96 | <0.001 | -0.81 | <0.001 | ||||||
| (0.13) | (0.08) | |||||||||
| South Asian ancestry | -1.14 | <0.001 | -1.00 | <0.001 | ||||||
| (0.21) | (0.13) | |||||||||
|
Random Effects |
||||||||||
| σ2 | 0.02 | 0.01 | 0.01 | 0.01 | ||||||
| τ00 | 0.08 site_id_l:rel_family_id | 0.07 site_id_l:rel_family_id | 0.04 site_id_l:rel_family_id | 0.03 site_id_l:rel_family_id | ||||||
| 0.00 site_id_l | 0.01 site_id_l | 0.00 site_id_l | 0.00 site_id_l | |||||||
| ICC | 0.85 | 0.84 | 0.8 | 0.79 | ||||||
| N | 22 site_id_l | 22 site_id_l | 22 site_id_l | 22 site_id_l | ||||||
| 3863 rel_family_id | 3863 rel_family_id | 8672 rel_family_id | 8672 rel_family_id | |||||||
| Observations | 4459 | 4459 | 10370 | 10370 | ||||||
| Marginal R2 / Conditional R2 | 0.464 / 0.918 | 0.527 / 0.925 | 0.739 / 0.948 | 0.754 / 0.948 | ||||||
Note: Beta coefficients (b) and p-values (p) from the mixed-effects models, with recruitment site and family common factors treated as random effects are shown. The values in parentheses are standard errors. The marginal and conditional R2s of the mixed-effects model are shown at the bottom. ICC = Intraclass Correlation Coefficient.
Next, Table 5 shows the regression results for predicting interviewer rated phenotype based on genetically predicted European appearance in the small twin sample that had phenotypic ratings. Model 1 shows the results without genetic ancestry, while models 2a and 2b add European ancestry and non-European ancestries, respectively. We note that our genetically predicted European appearance variable predicts interviewer-rated European phenotype over and above genetic ancestry. The results, for the equivalent Model 2a, are substantially the same when we subset to the 88 Blacks, Hispanics, and Others in the twin sample (Predicted European appearance b = .59; S.E. = .11) or when we additionally include parental reported race in the models. These additional results are provided in Table 2 of the supplementary file.
Table 5. Regression models with genetically predicted European appearance as the key independent variable and interviewer-rated phenotype as the dependent variable.
|
|
Model 1:
Phenotype ~ Predicted Phenotype |
Model 2a:
Phenotype ~ Predicted Phenotype w/European ancestry |
Models 2b:
Phenotype ~ Predicted Phenotype w/non-European Ancestries |
|||
| Predictors | b | P | b | P | b | P |
| (Intercept) | 0.04 (0.06) |
0.469 | -1.09 (0.27) |
<0.001 | 0.28 (0.09) |
0.001 |
| European appearance | 0.76 (0.04) |
<0.001 | 0.54 (0.07) |
<0.001 | 0.53 (0.07) |
<0.001 |
| Sex | -0.09 (0.08) |
0.286 | -0.08 (0.08) |
0.309 | -0.07 (0.08) |
0.360 |
| European ancestry | 1.32 (0.31) |
<0.001 | ||||
| African ancestry | -1.14 (0.33) |
0.001 | ||||
| Amerindian ancestry | -1.61 (0.45) |
<0.001 | ||||
| East Asian ancestry | -2.18 (3.10) |
0.483 | ||||
| South Asian ancestry | -11.22 (13.97) |
0.423 | ||||
| Observations | 239 | 239 | 239 | |||
| R2 / R2 adjusted | 0.584 / 0.581 | 0.614 / 0.610 | 0.619 / 0.610 | |||
Notes: Beta coefficients (b) and p-values (p) from the OLS regression models. The values in parentheses are standard errors. The marginal and conditional R2 of the mixed effects model are shown at the bottom.
3.2 Main results
Table 6 shows the main results with g as the dependent variable for the Black-Hispanic-Other sample. Its Model 1 reveals that the relation between predicted European appearance and g is statistically significant. When we add race and ethnicity in Model 2, this relation is reduced but still statistically significant. When we add SES, in Model 3, the effect is further reduced but still statistically significant. However, when we add genetic ancestry in Model 4a (without SES) and 4b (with SES) the relation becomes statistically non-significant. The results for the Black-Hispanic-Other-White sample, provided in the supplementary material, also reveal no statistically significant effect when adding European ancestry in Model 4a (without SES) and 4b (with SES).
Table 7 shows the main results, again for the Black-Hispanic-Other sample, using grades as the dependent variable. In this table, tobit regression is used. Model 1 reveals that the relation between predicted European appearance and grades is statistically significant. When we add race and ethnicity in Model 2, this relation is reduced but is still statistically significant. When we add SES, in Model 3, the effect is further reduced but is still statistically significant. Adding genetic ancestry in Models 4a and 4b (with SES) does not change this.
However, in the final Model (4b), the relation is only marginally statistically significant (p = 0.042). In contrast, the results for the Black-Hispanic-Other-White sample, provided in the supplementary material, show no statistically-significant effect of European appearance in Model 4a (without SES) and 4b (with SES). Moreover, the effects of European appearance in the Black-Hispanic-Other-White sample are trivial. Thus, the effect of European appearance on parent-reported grades only shows up in the Black-Hispanic-Other sample.
Table 6. Regression results for the effect of predicted European appearance on g in the Black-Hispanic-Other sample.
| M1: g ~ European appearance | M2: g ~ European appearance + race and ethnicity | M3: g ~ European appearance + race and ethnicity + SES | M4a: g ~ European appearance + race and ethnicity + European ancestry | M4b: g ~ European appearance + race and ethnicity + European ancestry + SES | ||||||||||||
| Predictors | b | P | b | P | b | P | b | P | b | P | ||||||
| Intercept | 0.31 (0.25) |
0.22 | 0.42 (0.26) |
0.11 | 0.38 (0.25) |
0.14 | -0.62 (0.28) |
0.03 | -0.28 (0.27) |
0.30 | ||||||
| age | -0.05 (0.02) |
0.03 | -0.05 (0.02) |
0.03 | -0.05 (0.02) |
0.03 | -0.04 (0.02) |
0.06 | -0.05 (0.02) |
0.04 | ||||||
| sex | 0.02 (0.03) |
0.45 | 0.03 (0.03) |
0.37 | 0.04 (0.03) |
0.22 | 0.02 (0.03) |
0.44 | 0.03 (0.03) |
0.26 | ||||||
| Predicted European appearance | 0.34 (0.02) |
<0.01 | 0.25 (0.03) |
<0.01 | 0.15 (0.03) |
<0.01 | 0.03 (0.04) |
0.41 | 0.01 (0.03) |
0.72 | ||||||
| Child US Born | 0.05 (0.08) |
0.55 | 0.05 (0.08) |
0.54 | 0.13 (0.08) |
0.09 | 0.07 (0.08) |
0.37 | 0.14 (0.08) |
0.07 | ||||||
| Immigrant Family | 0.25 (0.04) |
<0.01 | 0.20 (0.04) |
<0.01 | 0.12 (0.04) |
0.04 | 0.22 (0.04) |
<0.01 | 0.14 (0.04) |
0.01 | ||||||
| Frac Black | -0.31 (0.07) |
<0.01 | -0.23 (0.07) |
0.02 | 0.08 (0.08) |
0.36 | 0.02 (0.08) |
0.83 | ||||||||
| Frac Native American | -0.10 (0.12) |
0.40 | -0.05 (0.11) |
0.66 | -0.07 (0.12) |
0.58 | -0.03 (0.11) |
0.78 | ||||||||
| Frac NOC | -0.19 (0.06) |
0.01 | -0.07 (0.05) |
0.18 | -0.07 (0.06) |
0.23 | -0.00 (0.05) |
0.93 | ||||||||
| Hispanic | -0.05 (0.06) |
0.38 | -0.01 (0.05) |
0.86 | -0.04 (0.06) |
0.45 | -0.01 (0.05) |
0.86 | ||||||||
| SES | 0.35 (0.02) |
<0.01 | 0.32 (0.02) |
<0.01 | ||||||||||||
| European ancestry | 1.24 (0.13) |
<0.01 | 0.79 (0.12) |
<0.01 | ||||||||||||
| Random Effects | ||||||||||||||||
| σ2 | 0.52 | 0.52 | 0.51 | 0.51 | 0.51 | |||||||||||
| τ00 | 0.52 site_id_l:rel_family_id | 0.52 site_id_l:rel_family_id | 0.43 site_id_l:rel_family_id | 0.50 site_id_l:rel_family_id | 0.43 site_id_l:rel_family_id | |||||||||||
| 0.02 site_id_l | 0.02 site_id_l | 0.04 site_id_l | 0.02 site_id_l | 0.04 site_id_l | ||||||||||||
| ICC | 0.51 | 0.51 | 0.48 | 0.51 | 0.48 | |||||||||||
| N | 22 site_id_l | 22 site_id_l | 22 site_id_l | 22 site_id_l | 22 site_id_l | |||||||||||
| 3863 rel_family_id | 3863 rel_family_id | 3863 rel_family_id | 3863 rel_family_id | 3863 rel_family_id | ||||||||||||
| Observations | 4459 | 4459 | 4459 | 4459 | 4459 | |||||||||||
| Marginal R2 / Conditional R2 | 0.085 / 0.549 | 0.095 / 0.556 | 0.180 / 0.571 | 0.116 / 0.565 | 0.187 / 0.574 | |||||||||||
Notes: Beta coefficients (b) and p-values (p) from the mixed-effects models, with recruitment site and family common factors treated as random effects are shown. The values in parentheses are standard errors. The marginal and conditional R2 of the mixed effects model are shown at the bottom. ICC = Intraclass Correlation Coefficient.
Table 7. Tobit regression results for the effect of predicted European appearance on grades in the Black-Hispanic-Other sample.
| M1: Grades ~ European appearance | M2: Grades ~ European appearance + SIRE | M3: Grades ~ European appearance + SIRE + SES | M4a: Grades ~ European appearance + SIRE + European ancestry | M4b: Grades ~ European appearance + SIRE + European ancestry + SES | ||||||||||
| Predictors | b | P | b | p | b | P | b | P | b | P | ||||
| Age | -0.03 (0.03) |
0.27 | -0.03 (0.03) |
0.30 | -0.04 (0.03) |
0.24 | -0.03 (0.03) |
0.34 | -0.03 (0.03) |
0.25 | ||||
| Sex | 0.29 (0.04) |
<0.01 | 0.29 (0.04) |
<0.01 | 0.29 (0.04) |
<0.01 | 0.29 (0.04) |
<0.01 | 0.29 (0.04) |
<0.01 | ||||
| European appearance | 0.21 (0.02) |
<0.01 | 0.20 (0.03) |
<0.01 | 0.12 (0.03) |
<0.01 | 0.10 (0.04) |
0.01 | 0.09 (0.04) |
0.04 | ||||
| Child US Born | -0.07 (0.10) |
0.50 | -0.08 (0.10) |
0.43 | -0.03 (0.10) |
0.77 | -0.07 (0.10) |
0.47 | -0.03 (0.10) |
0.78 | ||||
| Immigrant Family | 0.07 (0.04) |
0.12 | 0.08 (0.05) |
0.12 | 0.03 (0.05) |
0.55 | 0.09 (0.05) |
0.08 | 0.03 (0.05) |
0.49 | ||||
| Frac Black SIRE | 0.00 (0.09) |
0.99 | 0.05 (0.09) |
0.54 | 0.16 (0.10) |
0.11 | 0.11 (0.10) |
0.25 | ||||||
| Frac Native American SIRE | 0.12 (0.14) |
0.36 | 0.15 (0.13) |
0.27 | 0.13 (0.14) |
0.33 | 0.15 (0.13) |
0.26 | ||||||
| Frac NOC SIRE | -0.13 (0.07) |
0.06 | -0.06 (0.07) |
0.40 | -0.08 (0.07) |
0.23 | -0.04 (0.07) |
0.55 | ||||||
| Hispanic | 0.03 (0.07) |
0.62 | 0.07 (0.07) |
0.27 | 0.04 (0.07) |
0.55 | 0.07 (0.07) |
0.26 | ||||||
| SES | 0.22 (0.02) |
<0.01 | 0.22 (0.02) |
<0.01 | ||||||||||
| European ancestry | 0.50 (0.15) |
0.01 | 0.19 (0.15) |
0.20 | ||||||||||
| Observations | 3814 | 3814 | 3814 | 3814 | 3814 | |||||||||
| R2 Nagelkerke | 0.056 | 0.058 | 0.089 | 0.061 | 0.089 | |||||||||
Notes: Beta coefficients (b) and p-values (p) from the tobit models, with recruitment site (not shown) added as dummy variables. The values in parentheses are standard errors.
Table 8, Model 1 shows the alternative multi-level regression results. For these, when we add genetic ancestry in Models 4a and 4b (with SES), the relation becomes statistically non-significant, although the model approaches statistical significance in the case of 4a (without SES) (p = 0.06). The results for the Black-Hispanic-Other-White sample, provided in the supplementary material, show no statistically significant effect of European appearance in Model 4a (without SES) and 4b (with SES). The discrepancy between the tobit and multilevel regression results could be due to not including random effects in the latter or due to censoring-related bias in the former. Regardless, the betas for both 4b models are fairly similar (b = .09 vs. b = .06) and suggest some unaccounted-for European appearance-related effect on parent-reported student grades.
Table 8. Mixed-effects regression results for the effect of predicted European appearance on grades in the Black-Hispanic-Other Sample.
| M1: Grades ~ European appearance | M2: Grades ~ European appearance + race and ethnicity | M3: Grades ~ European appearance + race and ethnicity + SES | M4a: Grades ~ European appearance + race and ethnicity + European ancestry | M4b: Grades ~ European appearance + race and ethnicity + European ancestry + SES | |||||||||||
| Predictors | b | P | b | P | b | P | b | P | b | P | |||||
| (Intercept) | 0.45 (0.29) |
0.11 | 0.42 (0.29) |
0.15 | 0.46 (0.29) |
0.11 | -0.03 (0.31) |
0.93 | 0.26 (0.31) |
0.40 | |||||
| Age | -0.06 (0.03) |
0.03 | -0.06 (0.03) |
0.04 | -0.06 (0.03) |
0.02 | -0.05 (0.03) |
0.04 | -0.06 (0.03) |
0.02 | |||||
| Sex | 0.34 (0.03) |
<0.01 | 0.34 (0.03) |
<0.01 | 0.34 (0.03) |
<0.01 | 0.34 (0.03) |
<0.01 | 0.34 (0.03) |
<0.01 | |||||
| Predicted European appearance | 0.19 (0.02) |
<0.01 | 0.17 (0.03) |
<0.01 | 0.10 (0.03) |
0.01 | 0.08 (0.04) |
0.06 | 0.06 (0.04) |
0.13 | |||||
| Child US Born | -0.15 (0.09) |
0.10 | -0.17 (0.09) |
0.07 | -0.11 (0.09) |
0.24 | -0.15 (0.09) |
0.09 | -0.10 (0.09) |
0.26 | |||||
| Immigrant Family | 0.04 (0.04) |
0.36 | 0.04 (0.05) |
0.38 | -0.02 (0.05) |
0.62 | 0.05 (0.05) |
0.27 | -0.02 (0.05) |
0.73 | |||||
| Frac Black | -0.00 (0.08) |
0.97 | 0.05 (0.08) |
0.54 | 0.16 (0.09) |
0.08 | 0.12 (0.09) |
0.19 | |||||||
| Frac Native American | 0.03 (0.13) |
0.81 | 0.07 (0.12) |
0.60 | 0.04 (0.13) |
0.74 | 0.07 (0.12) |
0.58 | |||||||
| Frac NOC | -0.20 (0.06) |
0.01 | -0.13 (0.06) |
0.03 | -0.14 (0.06) |
0.02 | -0.11 (0.06) |
0.07 | |||||||
| Hispanic | 0.05 (0.06) |
0.40 | 0.07 (0.06) |
0.26 | 0.06 (0.06) |
0.34 | 0.07 (0.06) |
0.24 | |||||||
| SES | 0.22 (0.02) |
<0.01 | 0.21 (0.02) |
<0.01 | |||||||||||
| European_ancestry | 0.53 (0.14) |
<0.01 | 0.23 (0.14) |
0.10 | |||||||||||
| Random Effects | |||||||||||||||
| σ2 | 0.76 | 0.75 | 0.75 | 0.75 | 0.75 | ||||||||||
| τ00 | 0.32 site_id_l:rel_family_id | 0.32 site_id_l:rel_family_id | 0.29 site_id_l:rel_family_id | 0.32 site_id_l:rel_family_id | 0.29 site_id_l:rel_family_id | ||||||||||
| 0.01 site_id_l | 0.01 site_id_l | 0.00 site_id_l | 0.01 site_id_l | 0.00 site_id_l | |||||||||||
| ICC | 0.30 | 0.30 | 0.28 | 0.30 | 0.28 | ||||||||||
| N | 22 site_id_l | 22 site_id_l | 22 site_id_l | 22 site_id_l | 22 site_id_l | ||||||||||
| 3296 rel_family_id | 3296 rel_family_id | 3296 rel_family_id | 3296 rel_family_id | 3296 rel_family_id | |||||||||||
| Observations | 3814 | 3814 | 3814 | 3814 | 3814 | ||||||||||
| Marginal R2 / Conditional R2 | 0.048 / 0.338 | 0.051 / 0.339 | 0.086 / 0.339 | 0.056 / 0.343 | 0.087 / 0.340 | ||||||||||
Notes: Beta coefficients (b) and p-values (p) from the mixed-effects models, with recruitment site and family common factors treated as random effects, are shown. The values in parentheses are standard errors. The marginal and conditional R2s of the mixed-effects model are shown at the bottom. ICC = Intraclass Correlation Coefficient.
We additionally computed the values of variance inflation factors (VIFs), which measure the amount of multicollinearity in a regression analysis. In cases of high multicollinearity, it can be difficult to distinguish between the effects of individual independent variables owing to high correlations among these. The full results for these tests for excessive multicollinearity are provided in Tab 5 of the supplementary file. For the Black-Hispanic-Other sample, the values of VIFs for predicted European appearance in Models 4a to 4b of Tables 6-8 ranged from 2.9 to 3.6. For the Black-Hispanic-Other-White sample, VIFs for predicted European appearance ranged from 4.0 to 4.6. Usually, a VIF value > 5 or, less strictly, > 10 is said to be problematic (James et al., 2013), but the values found here for European appearance are lower than these commonly-used thresholds, indicating that multicollinearity is not likely to be confounding our results. We also ran the models dropping the frac_SIRE variables, which, in the presence of European appearance, were leading to collinearity with European ancestry. As expected, doing so decreased the values of VIFs for European ancestry but did not substantially change the results.
3.3. Mediation analysis
The results from the causal mediation analyses are summarized in Table 9. The full results are provided in Tab 6 of the supplementary file. In both the Black-Hispanic-Other and the Black-Hispanic-Other-White samples, g was a substantial and statistically significant mediator of the relation between genetic ancestry and grades. In contrast, g was not a statistically significant mediator of the relation between European appearance and grades. In the Black-Hispanic-Other sample, European appearance had a significant total effect on grades (p = .03) with the same magnitude of effect as in Model M4a of table 7. Nonetheless, g was not a statistically significant mediator of the relation between predicted European appearance and grades.
Table 9. Summary of the causal mediation results for the full sample and race and ethnicity subsamples.
| Method: LMER | ||||||||
| Predictor | Mediator | Criterion | Mediation Effect | Proportion
of total effect mediated |
N | |||
| Black-Hispanic-Other | ||||||||
| Predicted European appearance | g | grades | 0.02 [ -0.01, 0.05] | 0.26 | 4459 | |||
| European Ancestry | g | grades | 0.53 [ 0.41, 0.66] | 1.03 | 3814 | |||
|
Black-Hispanic-Other-White |
||||||||
|
Predicted European appearance |
g | grades | 0.01 [-0.01, 0.03] | 0.25 | 10370 | |||
| European Ancestry | g | grades | 0.61 [0.53, 0.71] | 0.75 | 9128 | |||
| Method: LM-Tobit | ||||||||
| Predictor | Mediator | Criterion | Mediation Effect | Proportion
of total effect mediated |
N | |||
|
Black-Hispanic-Other |
||||||||
|
Predicted European appearance |
g | grades | 0.02 [ -0.01, 0.06] | 0.24 | 4459 | |||
| European Ancestry | g | grades | 0.54 [ 0.43, 0.67] | 1.12 | 3814 | |||
|
Black-Hispanic-Other-White
|
||||||||
| Predicted European appearance | g | grades | 0.01 [-0.01, 0.02] | 0.25 | 10370 | |||
| European Ancestry | g | grades | 0.52 [0.44, 0.60] | 0.83 | 9128 | |||
Notes: Statistically significant results (p < 0.05) are presented in bold.
3.4 Robustness analyses
As a robustness check, we reran the main regression analyses using the UKBB tanning and the HIrisPlex skin color variables instead of European appearance. These results are reported in Tab 8 and Tab 9 of the supplementary file. Neither the effects of UKBB tanning nor the effects of HIrisPlex skin color were close to significant for g or grades. So, using a composite indicator of hair, eye, and skin tanning/color instead of skin tanning/color alone did not decrease the effects. Rather, effects, particularly for grades, were stronger when using the European appearance predictor.
Next, we reran the main analyses on both the Hispanic (n = 2021 to 1741) and non-Hispanic Black (n = 1690 to 1432) subsamples. These results are shown in Tab 10 of the supplementary file. Again, European appearance, tanning, and color were not significantly related to either g or grades in the Hispanic and Black subsamples.
Additionally, we ran the analyses on all eleven cognitive subtests used to create g scores in addition to the NIHTBX fluid and crystallized composite scores. These results, for the Black-Hispanic-Other sample, are shown in Tab 13 of the supplementary file. We found statistically significant results only for the Picture Vocabulary test (b = 0.097; S.E. = .033), but not the other crystallized test, namely Oral Reading Recognition (b = 0.000; S.E. = .034). We also found marginally significant results for the crystallized composite scores (b = 0.068; S.E. = .033), which were due to the highly significant results for Picture Vocabulary, since the crystallized composite was derived from the Picture Vocabulary and Oral Reading Recognition tests. These results for crystallized composite scores and for Picture Vocabulary scores could represent a real effect, since it seems more likely that appearance-based discrimination would be present on a measure of knowledge and crystallized cognitive ability than fluid ability. Alternatively, this could represent a coincidence due to multiple testing (i.e., looking at the effects on eleven independent measures).
Finally, we tested for possible cross-trait assortative mating by examining if eduPGS scores predicted European appearance independent of European ancestry. These results are shown in Tab 11 of the supplementary file. We did not find significant associations between eduPGS and European appearance independent of European ancestry, which is inconsistent with the cross-trait assortative mating hypothesis.
Discussion
4.1. Discussion
The colorism model states that there is ongoing discrimination based on physical appearance in the Americas, which contributes to the link between European phenotype and better social outcomes. This model predicts that European appearance, regardless of ancestry, will have a positive impact on academic outcomes. We tested the colorism model using the admixture-regression methodology. Specifically, we hypothesized, first, that European appearance would be related to g when taking into account genetic ancestry, and second, that European appearance would have a relationship with grades independent of genetic ancestry. However, we found no substantial evidence to support the first hypothesis and only limited evidence to support the second. As a result, our findings do not strongly support the colorism hypothesis.
Additionally, due to meta-analyses showing a significant connection between g and grades, we formulated two more hypotheses: third, that g would play a role in the relationship between European ancestry and grades, and fourth, that g would play a role in the relationship between European appearance and grades. Our findings provided strong evidence for the third hypothesis, but not for the fourth hypothesis. This suggests that the relationship between European ancestry and grades is dependent on g, while the relationship between European appearance and grades is not dependent on g.
We conducted several robustness tests. When we used tanning or color, instead of European appearance, as the main predictor, we did not find any significant statistical connections between these two variables and either g or grades. Moreover, we did not find statistically significant associations when subsetting to the two largest admixed groups, Hispanics and Blacks. The lack of an association between either tanning or color and academic outcomes further weakens a colorism model, since this model places primacy on “the causal role of skin tone in engendering the colorism phenomenon” (Marira & Mitra, 2013, p. 103). So, we conclude that the outcomes are robust, and that the results of the robustness tests did not support a colorism model.
Across 15 outcome measures (g, grades, eleven subtests, the fluid ability composite, and the crystallized ability composite), three traits (European appearance, UKBB tanning, and HIrisPlex skin color), and four groupings (Black-Hispanic-Other-White, Black-Hispanic-Other, Black, and Hispanic) we found three statistically significant results, two of which were redundant (i.e., the effect on Crystalized intelligence resulted from the effect on Picture Vocabulary). Given that 15 different overlapping academic outcomes were examined across three traits, these results could simply be chance results due to multiple testing. Moreover, the interpretation of the results for grades is complicated since the grades were parent-reported, not actual school-reported grades, and since the parent-reported grades were very course (e.g., mostly As, mostly Bs, mostly Cs, etc.).
On the other hand, the three statistically significant results may make theoretical sense. Theorists of colorism have argued that colorism will manifest as a barrier to learning opportunities (Thompson & McDonald, 2016) and optimal education (Crutchfield et al., 2022), acting against less European-appearing students. On this basis, it is reasonable to hypothesize that the effects would be larger on crystalized abilities and outcomes dependent on teachers’ judgment. Therefore, future research should attempt to evaluate whether there are robust European-appearance effects on measures of crystalized ability and grades.
Regarding the general lack of association with respect to cognitive ability, one could perhaps argue that global genetic ancestry is a better predictor of overall racial appearance. Accordingly, discrimination might be based on an overall assessment of morphological differences, not just conspicuous race-associated differences in skin, eye, and hair color. However, this is somewhat different from what “colorists” have narrowly hypothesized, hence the term “colorism”. If race-associated discrimination is said to be based on ancestry-indexing phenotypes, then perhaps a good alternative term might be “ancestrysim”. It is not clear, though, why discrimination would be finely tuned to overall phenotypic markers of genetic ancestry instead of features that are stereotypic of racial groups.
A more likely explanation for these findings is that color is associated with cognitive ability predominantly because the color phenotype proxies global ancestry. Global ancestry could be related to how differences in these characteristics are inherited or passed on from parents to children along genealogical lines. Several researchers have argued that genetic ancestry might index social disparities intergenerationally transmitted for cultural, genetic, or epigenetic reasons (Corach & Caputo, 2022; da Silva et al., 2020; Fuerst & Kirkegaard, 2016). This possibility has largely been not discussed by sociologists who have focused instead on discriminatory or diffuse cultural models concerning disparities by caste, nation, ethnicity, or race. Our results suggest that researchers should also focus on genetic ancestry and identifying the specific genetic, epigenetic, and cultural factors which mediate the intergenerational transmission of academic outcomes.
4.2. Limitations
One could argue that our genetic predictor of European appearance is not perfectly reliable. However, frequently used skin tone scales, such as the Massey and Martin (2003) scale, have been found to have low reliabilities (Hannon & DeFina, 2016; 2020), so we would argue, based on our own results, that our genetically-predicted European appearance scores appear to be more reliable than the sorts of color measures which are typically used. A genetic-based predictor of color captures phenotype over an individual’s lifetime without the variability due to the low reliability of interviewer rating skin tone scales which have been found to be influenced by interviewer-rated characteristics such as race/ethnicity (Campbell et al., 2020; Cernat et al., 2019) or the interviewer’s perceptions about the participants socioeconomic status (Roth et al., 2022). So, we conclude that a genetic predictor of European appearance is preferable to interviewer-rated skin tone.
It is possible that there are substantial ancestry-independent associations between color and academic outcomes in other populations or for other academic traits. The novel admixture-regression method described here can be used to investigate if this is the case.
4.3 Implications
We focused on Hispanic, Black, Other, and White Americans. This is because, according to Marira and Mitra (2013, p. 104), “the most rigorous research concerning the nexus of colorism and labor market outcomes has been conducted on African American and Latino populations in the United States”. Given that the best support for colorism is said to come from the study of Black and Hispanic Americans, we would have expected the association between European appearance/color and academic outcomes to be robust in this sample. However, we did not find this to be the case, which weakens the colorism hypothesis.
Author contributions: All analyses were conducted by JGRF under the supervision of B. J. Pesta while at Cleveland State University (2020-2021). VS helped write and edit the paper.
Acknowledgments: Data used in the preparation of this article were obtained from the Adolescent Brain Cognitive Development (ABCD) Study (https://abcdstudy.org), held in the NIMH Data Archive (NDA). This is a multisite, longitudinal study designed to recruit more than 10,000 children aged 9-10 and follow them over 10 years into early adulthood. The ABCD Study® is supported by the National Institutes of Health and additional federal partners under award numbers U01DA041048, U01DA050989, U01DA051016, U01DA041022, U01DA051018, U01DA051037, U01DA050987, U01DA041174, U01DA041106, U01DA041117, U01DA041028, U01DA041134, U01DA050988, U01DA051039, U01DA041156, U01DA041025, U01DA041120, U01DA051038, U01DA041148, U01DA041093, U01DA041089, U24DA041123, U24DA041147. A full list of supporters is available at https://abcdstudy.org/federal-partners.html. A listing of participating sites and a complete listing of the study investigators can be found at https://abcdstudy.org/consortium_members/. ABCD consortium investigators designed and implemented the study and/or provided data, but did not necessarily participate in the analysis or writing of this report. This manuscript reflects the research results and interpretations of the authors alone and may not reflect the opinions or views of the NIH or ABCD consortium investigators. The ABCD data repository grows and changes over time. The ABCD data used in this report came from Version 3.01. The raw data are available at https://nda.nih.gov/edit_collection.html?id=2573. Additional support for this work was made possible from supplements to U24DA041123 and U24DA041147, the National Science Foundation (NSF 2028680), and Children and Screens: Institute of Digital Media and Child Development Inc. NDA waved the requirement of creating a NDA data project (NDA, Oct 26, 2022).
Conclusions
4.4. Conclusions
We found little support for the colorism hypothesis. Our results suggest that the relationship between racial appearance and academic outcomes cannot be considered as prima facie evidence of discrimination, as genetic ancestry, and the inherited disadvantage associated with it, is a plausible confounding variable. In future studies on colorism, it is recommended to consider genetic ancestry as a factor in the analyses. Because discrimination is such an important topic, it is essential that more studies are carried out before we are able to draw strong conclusions.
References
- Abascal, M., & Garcia, D. (2022). Pathways to Skin Color Stratification: The Role of Inherited (Dis) Advantage and Skin Color Discrimination in Labor Markets. Sociological Science, 9, 346-373.
- Akshoomoff, N., Beaumont, J. L., Bauer, P. J., Dikmen, S. S., Gershon, R. C., Mungas, D., … & Heaton, R. K. (2013). VIII. NIH Toolbox Cognition Battery (CB): Composite scores of crystallized, fluid, and overall cognition. Monographs of the Society for Research in Child Development, 78(4), 119-132.
- Bates, D., Mächler, M., Bolker, B. & Walker, S. (2015). Fitting linear mixed-effects models using lme4. Journal of Statistical Software, 67(1), 1–48.
- Bucca, M. E. (2018). Socioeconomic Inequality Among Racial Groups in the United States(Doctoral dissertation, Cornell University).
- Campbell, M. E., Keith, V. M., Gonlin, V., & Carter-Sowell, A. R. (2020). Is a picture worth a thousand words? An experiment comparing observer-based skin tone measures. Race and Social Problems, 12(3), 266-278.
- Campos-Vazquez, R. M., & Medina-Cortina, E. M. (2019). Skin color and social mobility: Evidence from Mexico. Demography, 56(1), 321-343.
- Cernat, A., Sakshaug, J. W., & Castillo, J. (2019). The Impact of interviewer effects on skin color assessment in a cross-national context. International Journal of Public Opinion Research, 31(4), 779-793.
- Chaitanya, L., Breslin, K., Zuñiga, S., Wirken, L., Pośpiech, E., Kukla-Bartoszek, M., … & Walsh, S. (2018). The HIrisPlex-S system for eye, hair and skin colour prediction from DNA: Introduction and forensic developmental validation. Forensic Science International: Genetics, 35, 123-135.
- Chavent, M., Kuentz-Simonet, V., Labenne, A. & Saracco, J. (2014). Multivariate analysis of mixed data: The R Package PCAmixdata. arXiv.1411.4911
- Connor, G., & Fuerst, J.G.R. (2023). Linear and Partially Linear Models of Behavioral Trait Variation Using Admixture Regression. In Lynn, R. (Ed.). Intelligence, Race and Sex: Some Controversial Issues: A Tribute to Helmuth Nyborg at 85. London: Arktos.
- Corach, D., & Caputo, M. (2022). Social injustice unveiled by genetic analysis: Argentina as a case study. American Journal of Human Biology, e23820.
- Crutchfield, J., Keyes, L., Williams, M., & Eugene, D. R. (2022). A Scoping Review of Colorism in Schools: Academic, Social, and Emotional Experiences of Students of Color. Social Sciences, 11(1), 15.
- da Silva, A. K. L. S., Madrigal, L., & da Silva, H. P. (2020). Relationships among genomic ancestry, clinical manifestations, socioeconomic status, and skin color of people with sickle cell disease in the State of Pará, Amazonia, Brazil. Antropologia Portuguesa, (37), 159-176.
- Dixon, A. R., & Telles, E. E. (2017). Skin color and colorism: Global research, concepts, and measurement. Annual Review of Sociology, 43(1), 405-424.
- Fox, J., Weisberg, S., Adler, D., Bates, D., Baud-Bovy, G., Ellison, S., … & Monette, G. (2012). Package ‘car’. Vienna: R Foundation for Statistical Computing, 16.
- Francis-Tan, A. (2016). Light and shadows: an analysis of racial differences between siblings in Brazil. Social Science Research, 58, 254-265.
- Francis, A. M., & Tannuri-Pianto, M. (2012). The redistributive equity of affirmative action: Exploring the role of race, socioeconomic status, and gender in college admissions. Economics of Education Review, 31(1), 45–55.
- Fuerst, J. G., Hu, M., & Connor, G. (2021). Genetic ancestry and general cognitive ability in a sample of American youths. Mankind Quarterly, 62(1).
- Fuerst, J. G. (2021). Robustness analysis of African genetic ancestry in admixture regression models of cognitive test scores. Mankind Quarterly, 62(2).
- Fuerst, J. G., Lynn, R., & Kirkegaard, E. O. (2019). The Effect of Biracial Status and Color on Crystallized Intelligence in the US-Born African–European American Population. Psych, 1(1), 44-54.
- Gignac, G. E., & Szodorai, E. T. (2016). Effect size guidelines for individual differences researchers. Personality and Individual Differences, 102, 74-78.
- Hailu, S. (2018). Skin-Tone and Academic Achievement Among 5-year-old Mexican Children. Master’s Thesis, Virginia Commonwealth University Richmond, Richmond, VA, USA.
- Hall, R. E. (2020). The DuBoisian talented tenth: Reviewing and assessing mulatto colorism in the post-DuBoisian era. Journal of African American Studies, 24(1), 78-95.
- Hannon, L. (2014). Hispanic respondent intelligence level and skin tone: Interviewer perceptions from the American national election study. Hispanic Journal of Behavioral Sciences, 36(3), 265-283.
- Hannon, L., & DeFina, R. (2016). Reliability concerns in measuring respondent skin tone by interviewer observation. Public Opinion Quarterly, 80(2), 534-541.
- Hannon, L., & DeFina, R. (2020). The reliability of same-race and cross-race skin tone judgments. Race and Social Problems, 12(2), 186-194.
- Harris, A. P. (2008). From color line to color chart: Racism and colorism in the new century. The Berkeley Journal of African-American Law & Policy, 10, 52.
- Heeringa, S. G., & Berglund, P. A. (2020). A guide for population-based analysis of the Adolescent Brain Cognitive Development (ABCD) Study baseline data. BioRxiv. doi:https://doi.org/10.1101/2020.02.10.942011
- Hernández, T. K. (2015). Colorism and the law in Latin America-global perspectives on colorism conference remarks. Washington University Global Studies Law Review,14, 683.
- Hill, M. E. (2002). Skin color and intelligence in African Americans: A reanalysis of Lynn’s data. Population and Environment, 24(2), 209-214.
- Hochschild, J. L., & Weaver, V. (2007). The skin color paradox and the American racial order. Social Forces, 86(2), 643-670.
- Hu, M., Lasker, J., Kirkegaard, E. O., & Fuerst, J. G. (2019). Filling in the gaps: The association between intelligence and both color and parent-reported ancestry in the National Longitudinal Survey of Youth 1997. Psych, 1(1), 240-261.
- Huddleston, D. A., & Montgomery, L. (2010). A Scholarly Response to Shades of Black. In: Lewis, C., Jackson, J., Eds, pp. 63-76. Black in America: A Scholarly Response to the CNN Documentary.
- Hunter, M. L. (2013). The consequences of colorism. In R. E. Hall (Ed.), The melanin millennium: Skin color as 21st century international discourse (pp. 247–256). Springer Netherlands.
- James, G., Witten, D., Hastie, T., & Tibshirani, R. (2013). An introduction to statistical learning(Vol. 112). New York: Springer.
- Jensen, A. R. (1998). The g factor. Westport, CT: Prager.
- Kim, Y., & Calzada, E. J. (2019). Skin color and academic achievement in young, Latino children: Impacts across gender and ethnic group. Cultural Diversity and Ethnic Minority Psychology, 25(2), 220-231.
- Kim, J., Edge, M. D., Goldberg, A., & Rosenberg, N. A. (2021). Skin deep: The decoupling of genetic admixture levels from phenotypes that differed between source populations. American Journal of Physical Anthropology, 175(2), 406-421.
- Kirkegaard, E. O., Wang, M., & Fuerst, J. G. (2017). Biogeographic Ancestry and Socioeconomic Outcomes in the Americas: A Meta-Analysis. Mankind Quarterly, 57(3).
- Kizer, J. (2017). Skin color stratification and the family: Sibling differences and the consequences for inequality(Doctoral dissertation, UC Irvine).
- Kleiber, C., Zeileis, A., & Zeileis, M. A. (2020). Package ‘aer’. R package version, 12(4).
- Koo, T. K., & Li, M. Y. (2016). A guideline of selecting and reporting intraclass correlation coefficients for reliability research. Journal of Chiropractic Medicine, 15(2), 155-163.
- Kreisman, D., & Rangel, M. A. (2015). On the blurring of the color line: Wages and employment for Black males of different skin tones. Review of Economics and Statistics, 97(1), 1-13.
- Lasker, J., Pesta, B. J., Fuerst, J. G., & Kirkegaard, E. O. (2019). Global ancestry and cognitive ability. Psych, 1(1), 431-459.
- Lee, J. J., Wedow, R., Okbay, A., Kong, E., Maghzian, O., Zacher, M., … & Social Science Genetic Association Consortium. (2018). Gene discovery and polygenic prediction from a 1.1-million-person GWAS of educational attainment. Nature Genetics, 50(8), 1112.
- Leite, T. K., Fonseca, R. M., França, N. M. D., Parra, E. J., & Pereira, R. W. (2011). Genomic ancestry, self-reported “color” and quantitative measures of skin pigmentation in Brazilian admixed siblings. PloS one, 6(11), e27162.
- Liu, M. M., Crowe, M., Telles, E. E., Jiménez-Velázquez, I. Z., & Dow, W. H. (2022). Color disparities in cognitive aging among Puerto Ricans on the archipelago. SSM-Population Health, 17, 100998.
- Marira, T. D., & Mitra, P. (2013). Colorism: Ubiquitous yet understudied. Industrial and Organizational Psychology, 6(1), 103-107.
- Marteleto, L. J., & Dondero, M. (2016). Racial inequality in education in Brazil: A twins fixed-effects approach. Demography, 53(4), 1185-1205.
- Massey D., & Martin J. (2003). The NIS Skin Color Scale. Princeton, NJ: Princeton University Press.
- Mill, R. & Stein, L. (2016). Race, Skin Color, and Economic Outcomes in Early Twentieth-Century America. Available at SSRN: https://ssrn.com/abstract=2741797or http://dx.doi.org/10.2139/ssrn.2741797
- Mooney, J. A., Agranat-Tamir, L., Pritchard, J. K., & Rosenberg, N. A. (2022). On the number of genealogical ancestors tracing to the source groups of an admixed population. arXiv preprint arXiv:2210.12306.
- Norris, E. T., Rishishwar, L., Wang, L., Conley, A. B., Chande, A. T., Dabrowski, A. M., … & Jordan, I. K. (2019). Assortative mating on ancestry-variant traits in admixed Latin American populations. Frontiers in Genetics, 10, 359.
- Rangel, M. A. (2015). Is parental love colorblind? Human capital accumulation within mixed families. The Review of Black Political Economy, 42(1-2), 57-86.
- Reuter, E. B. (1917). The superiority of the mulatto. American Journal of Sociology, 23(1), 83-106.
- Revelle, W., & Revelle, M. W. (2015). Package ‘psych’. The comprehensive R archive network, 337, 338.
- Roth, B., Becker, N., Romeyke, S., Schäfer, S., Domnick, F., & Spinath, F. M. (2015). Intelligence and school grades: A meta-analysis. Intelligence, 53, 118-137.
- Roth, W. D., Solís, P., & Sue, C. A. (2022). Beyond money whitening: Racialized hierarchies and socioeconomic escalators in Mexico. American Sociological Review, 87(5), 827-859.
- Ryabov, I. (2013). Colorism and school-to-work and school-to-college transitions of African American adolescents. Race and Social Problems, 5(1), 15-27.
- Ryabov, I. (2016). Educational outcomes of Asian and Hispanic Americans: The significance of skin color. Research in Social Stratification and Mobility, 44, 1-9.
- Schachter, A., Flores, R. D., & Maghbouleh, N. (2021). Ancestry, color, or culture? How whites racially classify others in the US. American Journal of Sociology, 126(5), 1220-1263.
- Telles, E. (2004). Race in Another America: The Significance of Skin Color in Brazil. Princeton, N.J.: Princeton University Press.
- Telles, E., Flores, R. D., & Urrea-Giraldo, F. (2015). Pigmentocracies: Educational inequality, skin color and census ethnoracial identification in eight Latin American countries. Research in Social Stratification and Mobility, 40, 39-58.
- Telles, E., & Paschel, T. (2014). Who is black, white, or mixed race? How skin color, status, and nation shape racial classification in Latin America. American Journal of Sociology, 120(3), 864-907.
- Tingley, D., Yamamoto, T., Hirose, K., Keele, L., Imai, K., and Yamamoto, M. T. (2017). Package ‘Mediation’. https://imai.fas.harvard.edu/projects/mechanisms.html.
- Thompson, M. S., & McDonald, S. (2016). Race, skin tone, and educational achievement. Sociological Perspectives, 59(1), 91-111.
- Thompson, W.K., Barch, D.M., Bjork, J.M., Gonzalez, R., Nagel, B.J., Nixon, S.J. & Luciana, M. (2019). The structure of cognition in 9- and 10-year-old children and associations with problem – behaviors: Findings from the ABCD study’s baseline neurocognitive battery. Developmental Cognitive Neuroscience 36: 100606
- Walsh, S., Chaitanya, L., Breslin, K., Muralidharan, C., Bronikowska, A., Pospiech, E., … & Kayser, M. (2017). Global skin colour prediction from DNA. Human Genetics, 136(7), 847-863.
- Walsh, S., Chaitanya, L., Clarisse, L., Wirken, L., Draus-Barini, J., Kovatsi, L., … & Kayser, M. (2014). Developmental validation of the HIrisPlex system: DNA-based eye and hair colour prediction for forensic and anthropological usage. Forensic Science International: Genetics, 9, 150-161.
- Weissbrod, O., Hormozdiari, F., Benner, C., Cui, R., Ulirsch, J., Gazal, S., … & Price, A. L. (2020). Functionally informed fine-mapping and polygenic localization of complex trait heritability. Nature Genetics, 52(12), 1355-1363.
- Weissbrod, O., Kanai, M., Shi, H., Gazal, S., Peyrot, W. J., Khera, A. V., Okada, Y., Matsuda, K., Yamanashi, Y., Furucawa, Y., Morisaki, T., Murakami, Y., Kamatani, Y., Muto, K., Nagai, A., Obara, W., Yamaji, K., Takahashi, K., Asai, S., … Price, A. L. (2022). Leveraging fine-mapping and multipopulation training data to improve cross-population polygenic risk scores. Nature Genetics, 54(4), 1–9.
- Zou, J. Y., Park, D. S., Burchard, E. G., Torgerson, D. G., Pino-Yanes, M., Song, Y. S., … & Zaitlen, N. (2015). Genetic and socioeconomic study of mate choice in Latinos reveals novel assortment patterns. Proceedings of the National Academy of Sciences, 112(44), 13621-13626.
Comments (0)
In the Americas, less European-looking people have on average worse academic outcomes than more European-looking people. According to the colorism model, these associations between race-related phenotype and academic-related outcomes are due to contemporary phenotypic-based discrimination and not due to family-background or intergenerational factors. Previous studies have attempted to use sibling designs to disentangle the latter two causes from the effects of discrimination. We argue that admixture-regression analysis is an additional helpful tool for disentangling the various causes. Using a large, genetically-informed dataset, we created a genetically-based predictor of European appearance. We tested the hypothesis that European appearance will be associated with academic outcomes independent of genetic ancestry. We also tested the hypothesis that g mediated the relations between ancestry/European appearance and grades. We did not find evidence of this in the case of g (and most cognitive tests), but we did find tentative evidence in the case of parent-reported grades. When genetic ancestry was included in the models, European appearance was not significantly related to g. We also found that while g was a substantial and statistically significant mediator of the association between European ancestry and grades, this was not the case in the context of European appearance and grades. These results are in line with the position that cognitive inequalities in the US are intergenerationally transmitted, and are not the result of contemporaneous color-based discrimination. The admixture-regression method employed here could be applied to different outcomes to test for evidence of phenotypic-based discrimination or, at least, family-background independent effects.
In the Americas, research shows that less European-looking and/or darker-looking people are on average less successful than more European-looking and/or lighter-looking people. For example, stereotypically race-related phenotypes, such as skin, hair, and eye color, are generally associated with better socioeconomic outcomes (Hochschild, & Weaver, 2007; Hunter, 2013). Many sociologists attribute this association to phenotypic-based discrimination, also known as “colorism” (e.g., Dixon & Telles, 2017). According to theorists of colorism, phenotypic-based discrimination is common in the Americas, favoring individuals with stereotypical European phenotypes. This discrimination is hypothesized to result in better health, higher occupational and educational attainment, and other more positive outcomes for individuals with a paler or ‘whiter’ appearance; even among those categorized as belonging to the same race/ethnicity, the paler ones will do better than the darker ones (Hochschild & Weaver, 2007; Marira & Mitra, 2013).
Proponents of this colorism model frequently maintain that ‘race’ is a social construct according to which people are arbitrarily categorized based on geographic origins and physical appearance and that modern racial categories have originated primarily based on the work of eighteenth- and nineteenth-century European naturalists and anthropologists (Dixon & Telles, 2017). ‘Color,’ in contrast, is not a social construct but refers to gradations of physical appearance associated with different levels of skin tone (Dixon & Telles, 2017). Theorists of the colorism model place primacy on “the causal role of skin tone in engendering the colorism phenomenon” (Marira & Mitra, 2013, p. 103). Many theorists of colorism argue that other visually conspicuous, stereotypically race-associated traits such as hair color, eye color, hair texture, and facial features may also elicit phenotypic discrimination (Crutchfield et al., 2022; Ryabov, 2013).
In addition to differences in income, health outcomes, and occupational status, colorism has been invoked to explain academic and cognitive differences, including differences in attained years of education, grade point average, and academic/cognitive test scores (Hailu, 2018; Hill, 2002; Kim & Calzada, 2019; Liu et al., 2022; Thompson & McDonald, 2016). In their review, Crutchfield et al. (2022, p. 10) conclude that “lighter skin tones and more Eurocentric features were linked to better academic outcomes, including higher GPAs, additional years of schooling, [and] improved academic performance”.
Concerning specific mechanisms by which individual variability in color could be linked to variation in academic and cognitive outcomes, Thompson and McDonald (2016, p. 6) argue for discrimination, including “direct mechanisms – educational encouragement, evaluation, and provision of learning opportunities – as well as indirect mechanisms – the use of disciplinary actions”. Crutchfield et al. (2022, p. 10) similarly emphasize teacher-student relations as causes, further noting that “darker-skinned students face the greatest barriers to optimal educational outcomes due to differential treatment”. Similarly, Hannon (2014) suggests that adults and educators may have a light-skin-equals-intelligence bias which, in turn, influences both their expectations and their treatment of children of different complexion.
According to theorists of colorism, appearance-based outcome differences directly result from appearance-based discrimination. Ancestry or racial identification matters in so far as “racial classifications are determined more closely by how one phenotypically appears to belong to one race rather than strictly by one’s ancestors” (Hernández, 2015, p. 684), and the same author argues that this is especially true in parts of Latin America. As Hall (2020, p. 79) notes, “in consideration of racism as pertains to colorism, ultimately such biological attributes as ancestry and bloodline may be all but completely irrelevant in the course of discrimination via various acts of colorism”. Making a related point, Harris (2008, p. 61) states that “[t]raditional racism places a higher value on ancestry than colorism… while colorism assigns people to places along a spectrum from dark to light, indigenous or African to European”. Thus, from the perspective of the proponents of colorism, ancestry per se is irrelevant.
If color phenotypes are found to merely proxy the effects of genetic ancestry, the results would be more consistent with what Abascal and Garcia (2022) describe as the inherited (dis)advantage model or what Hu et al. (2019) name the distributional model, and which we consider essentially the same model. According to this model, for various reasons, populations differ in traits, and these trait differences are transmitted vertically or intergenerationally. Because both racial appearance/color and family heritage, including ancestry, correlate in ancestrally heterogeneous populations, there is potential confounding between ancestry-related family influences and discrimination conditioned on color phenotypes.
Due to a concern for confounding, some research has attempted to control for intergenerational factors by employing sibling designs and measuring academic or educational outcomes (Bucca, 2018; Francis-Tan, 2016; Francis & Tannuri-Pianto, 2012; Hu et al.,2019; Kizer, 2017; Marteleto & Dondero, 2016; Mill & Stein, 2016; Rangel, 2015; Ryaboy, 2016; Telles, 2004). The reasoning is that in recently-admixed populations, siblings may differ noticeably in race-associated phenotypes such as skin color (see: e.g., Leite et al., 2011), but siblings will exhibit little differences in genetic ancestry and no difference in family environment. As a result, with a sibling design, it should be possible to disentangle appearance-based effects from family-heritage-based ones. The academic outcome differences examined in these studies include the following variables: educational attainment (Buca, 2018; Francis-Tan, 2016; Kizer, 2017; Marteleto & Dondero, 2016; Mill & Stein, 2016; Rangel, 2015; Ryaboy, 2016), grade-point average (Francis & Tannuri-Pianto, 2012), age-appropriate grade (Telles, 2004), aptitude test scores (Francis & Tannuri-Pianto, 2012; Hu et al.,2019), and literacy (Mill & Stein, 2016).
Most researchers either found modest associations between color phenotype and academic outcomes among siblings and interpreted their results as mainly supporting an intergenerational model (Francis-Tan, 2016; Mill & Stein, 2016; Rangel, 2015) or reported slight within-sibship differences but interpreted these as support for some color-based discrimination (Telles, 2004). However, a minority of researchers reported substantial and statistically significant within-sibship effects (Marteleto & Dondero, 2016; Ryabov, 2016). Although no formal meta-analysis has been conducted, carefully studying all the outcomes shows a relatively small overall within-sibships effect. The results from the eight sibling studies involving academic outcomes are reviewed in Table 15 of the supplementary file. As seen in 16 out of 20 effects, darker siblings have on average worse academic outcomes, and the mean effect between siblings is about 10% of the effect, unconditioned on family background, among families or in the population. These analyses, though, have been limited by the modest number of variables available in the case of the census-based studies (e.g., Francis-Tan, 2016; Mill & Stein, 2016; Rangel, 2015; Telles, 2004) or non-optimal statistical power in the case of the longitudinal studies (e.g., Buca, 2018; Hu et al., 2019; Kizer, 2017).
An alternative approach to testing colorism vs. inheritance hypotheses involves using admixture-regression designs (e.g., Connor & Fuerst, 2023; Fuerst, 2021; Fuerst et al., 2021). In these designs, recently-admixed populations are treated as natural experiments, and this admixture is used to disentangle various cultural, environmental, and genetic factors. In the present context, the design is employed to try to disentangle inherited (dis)advantages associated with racial appearance from non-inherited (dis)advantages due to, for example, contemporaneous discrimination. For this purpose, global genetic ancestry and either a phenotype or genetic markers of a phenotype are included in a regression analysis along with other variables. The objective is to determine whether racial appearance affects outcomes independent of global genetic ancestry.
A theoretical path model is presented in Figure 1. The colorism model posits that discrimination based on phenotype results in disparities in cognitive abilities and
other academic outcomes through the direct effects of discrimination on learning. According to this model, in populations with a mix of ancestries, academic performance is likely indirectly linked to genetic ancestry due to the correlation between racial phenotypes and genetics. Conversely, the inherited disadvantage model argues that genetic and cultural factors, which are tied to global ancestry, drive academic outcome disparities. Because genetic ancestry is correlated with racial phenotypes, academic related traits will tend to be indirectly correlated with racial phenotype in admixed populations. In the admixture-regression design, global genetic ancestry is controlled for to account for inherited disadvantages.
Figure 1. Theoretical Model of the Association between Putative Causes (Discrimination vs. Inherited Disadvantage), Ancestry, Racial-Phenotype, Academic Outcomes, and Parental-Socioeconomic Status.
The colorism model clearly predicts that racial appearance affects outcomes independent of genetic ancestry. If the model is correct, individuals with lighter skin, hair, and eye color should have better outcomes controlling for overall genetic ancestry. An opposite finding would be consistent with an intergenerational model, according to which traits conducive to better outcomes are being transmitted down lines of descent as indexed by genetic ancestry. This inheritance of traits could be mediated by genes, epigenetic factors, or culturally-inherited factors. Applying the admixture-regression design to data from the US and Brazil suggests that educational attainment and cognitive ability are primarily related to genetic ancestry, and are mostly unrelated to racial appearance (Fuerst et al., 2021; Kirkegaard et al., 2017; Lasker et al., 2019).
The admixture-regression design comes with a couple of assumptions that can be easily tested. The first assumption is that there is little cross-assortative mating for race-associated phenotype and the relevant traits (e.g., cognitive ability). In the presence of such assortment, race-associated phenotype can become genetically correlated with the outcomes independent of ancestry (Jensen, 1998). If so, race-associated phenotype and outcomes may be associated with one another, independent of ancestry, for genetic and not discriminatory reasons. The second assumption is that there is no substantial reverse causation from outcomes to race-associated phenotype; for example, low-prestige occupations often are associated with increased outdoor work, sun exposure, and, consequently, darker color. These two assumptions are common to colorism research, but, in this design, they only become a concern if an association between race-associated phenotype and outcomes is found independent of genetic ancestry.
The third assumption is that genetic ancestry and racial appearance are not collinear in samples. Dissociation between race-associated traits, especially non-highly polygenic ones, and genetic ancestry is expected in admixed populations due to genetic crossover and segregation (Kim et al., 2021). The extent of dissociation is an empirical question. The final assumption is that inherited (dis)advantages correspond with differences in ancestry. This is expected based on a simple model of vertical transmission of inherited traits given an initial inequality between groups and assuming that the estimated ancestry corresponds with the percentage of ancestors of relevant parental groups. In admixed American groups this assumption holds, because genetic ancestry percentages can be understood in terms of the number of ancestors from different ancestry groups (e.g., Mooney et al., 2022).
Most studies on the effects of racial appearance use single phenotypic measures of appearance. However, interviewer-rated color scales, in particular, have often been found to have modest reliability (Campbell et al., 2020; Hannon & DeFina, 2016; Hannon & DeFina, 2020). Moreover, skin color ratings have been found to be influenced by interviewer-related characteristics (Campbell et al., 2020; Cernat et al., 2019) and, additionally, the interviewer’s perceptions about the participants’ socioeconomic status (Roth et al., 2022). So, there are some concerns about the reliability and validity of skin color ratings. An alternative approach is to use genetic predictors of phenotype; they have an advantage in that they do not suffer from the problems of reverse causality and interviewer-related biases. Therefore, in this study, we created several new genetically-based predictors of European appearance. Moreover, we combine these predictors of skin, hair, and eye color through factor analysis to increase reliability. Afterward, we conducted admixture-regression analyses to test if European appearance was associated with general intelligence (g) and school grades independently of global genetic ancestry, as predicted by theorists of colorism. Cognitive ability was of particular interest because it has been found to partially mediate the relation between color and other outcomes (Campos-Vazquez & Medina-Cortina, 2019; Fuerst et al., 2019; Kreisman & Rangel, 2015). Therefore, cognitive ability differences may partially explain the relationship between color and socioeconomic or academic outcome differences. For this reason, Huddleston and Montgomery (2010, p. 69) note that “more research is needed in intragroup differences among Blacks and intelligence… Results from this research have huge implications for the skin tone hierarchy in the African American community”. In line with this recommendation, we examine the extent to which cognitive ability plays a mediating role for genetic ancestry and grades.
As we already noted, studies which have used sibling designs overall show a modest association between European appearance and academic outcomes. Based on these results, we hypothesized that European appearance will show an association with both g and grades in regression models which also include genetic ancestry. Moreover, meta-analyses indicate that general mental ability and school grades are highly correlated (e.g., Roth et al., 2015), so we hypothesized that the relation between both European appearance and genetic ancestry and between school grades will be strongly mediated by g.
2.1. Sample
The Adolescent Brain Cognitive Development Study (ABCD) is a collaborative longitudinal project involving 21 collection sites across the US. It was created to research the psychological and neurobiological bases of human development. At baseline, around 11,000 9-10-year-old children were sampled, mostly from public and private elementary schools. A probabilistic sampling strategy was used to create a broadly representative sample of the population for this age group. We used the 3.0 data release.
For the main analyses, we focused on the 3814 (with grades) to 4459 (with g scores) individuals who were parentally identified as Black, Hispanic, Native American, or Other; we also included individuals who were marked as belonging to multiple race/ethnic categories. The choice to focus on these ethnic groups was influenced by Marira and Mitra (2013), who note that “the most rigorous research concerning the nexus of colorism and labor market outcomes has been conducted on African American and Latino populations in the United States” (p. 104). Although there is little ancestry-related color variability among non-Hispanic White Americans, we also ran the analyses including this group; we relegated most of these results to the supplementary file. We excluded anyone who was parentally identified as East Asian, South Asian, or Pacific Islander primarily because there were potential problems with reliable and interpretable East and South Asian ancestry estimates. Among South Asians, admixture estimates capture both recent and archaic Indo-European admixture, rendering the interpretation of these estimates unclear. Moreover, since we were unable to create a separate Pacific Islander ancestry component due to a lack of reference samples, East Asian and Pacific Islander ancestry was confounded. In contrast, the interpretation of European, African, and Amerindian admixture among Black, Hispanic, and Native American populations is unambiguous since this admixture occurred within the last 500 years, following the Age of Discovery and the settling of the New World.
2.2. Variables
A number of theoretically relevant variables were used. They are described in the sections below.
2.2.1 Admixture estimates
The ABCD Research Consortium conducted the imputing and genotyping using Illumina XX. Quality control was performed using PLINK 1.9; a total of 516,598 genetic variants survived the quality control. When computing admixture estimates, we used only directly genotyped, bi-allelic, autosomal SNP variants (494,433 before, 493,196 after lifting). We filtered variants in the reference population dataset to reduce bias from sample non-representativeness. Variants were pruned for linkage disequilibrium at the 0.1 R² level using PLINK 1.9 (–indep-pairwise 10000 100 0.1), leaving 99,642 variants after pruning. Next, target samples from ABCD were merged with reference population data from 1000 Genomes and HapMap. We excluded the following 1000 Genomes and HGDP reference populations: Adygei, Balochi, Bedouin, Bougainville, Brahui, Burusho, Druze, Hazara, Makrani, Mozabite, Palestinian, Papuan, San, Sindhi, Uygur, and Yakut. These populations were excluded because either they were overly admixed or because the individuals in the ABCD sample lacked significant portions of these ancestries (as in the case of Melanesians and San). The ABCD target sample was then split into 50 random subsets (of approximately 222 persons each) and merged sequentially with the reference data. Repeat subsetting was done to avoid skewing the admixture algorithm to European ancestry, as this ancestry was dominant in the ABCD sample. Next, we performed cluster analysis and estimated ancestry based on a k = 5 solution (European, Amerindian, African, East Asian, and South Asian ancestries), as this provided the most comprehensive yet also parsimonious model of the US population and captured all predominant ancestral backgrounds in the US population. Our European, African, and Amerindian estimates perfectly correlated with the estimates provided in the ABCD dataset (genetic_af_european, genetic_af_african, and genetic_af_european). As ABCD does not clearly document the construction of these estimates, we used our own ancestry estimates instead.
2.2.2. General cognitive ability, 11 cognitive tests, and NIHTBX fluid and crystal composite scores
The baseline ABCD data contained the following cognitive tests: Picture Vocabulary, Flanker, List Sorting, Card Sorting, Pattern Comparison, Picture Sequence Memory, Oral Reading Recognition, Wechsler Intelligence Scale for Children’s Matrix Reasoning, the Little Man Test (efficiency score), the Rey Auditory Verbal Learning Test (RAVLT) immediate recall, and RAVLT delayed recall. The first seven of these are from the NIH Toolbox® cognitive battery. For details about these measures, see Thompson et al. (2019). In addition, ABCD provides a precomputed measure of crystallized cognitive ability (based on the Picture Vocabulary Test and the Oral Reading Recognition Test) and a measure of fluid cognitive ability (based on Flanker, List Sorting, Card Sorting, Pattern Comparison, and Picture Sequence Memory) measures. Details of these measures are provided by Akshoomoff et al. (2014). The crystallized ability subtests are said to be more dependent on learning experience and “represent accumulated store of verbal knowledge and skills, and thus are more heavily influenced by education and cultural exposure, particularly during childhood” (Akshoomoff, 2014, p. 120).
We computed g scores via the multi-group confirmatory factor-analytic method detailed in Fuerst et al. (2021). In this earlier publication, we outputted the g scores from the best-fitting and, additionally most-parsimonious model. In this case, g alone was found to explain the mean parentally-identified race and ethnicity (henceforth ‘race and ethnicity’) differences. Scores were standardized (M = 0.00; SD = 1.00) on the total sample of 10,370 children.
2.2.3. Grades
Parents were asked: “What kind of grades does your child get on average?” (1 = As /2 = Bs /3 = Cs / 4 = Ds / 5 = Fs). We recoded this variable using a 4-point scale as is commonly used in the US (with 4.0 representing an A, 3.0 representing a B, etc.), and then standardized the scores (M = 0.00; SD = 1.00). These data were available for N = 9128 for the Black-Hispanic-Other-White sample and N = 3814 for the Black-Hispanic-Other sample.
2.2.4. Child US-born and immigrant family
Parents reported if the child was born in the United States. This variable is recoded as “1” if the child was born in the United States and “0” for all other responses. Additionally, parents reported if any family members (including the child’s maternal or paternal grandparents) were born outside of the United States. This variable, immigrant family, was also recoded as “1” if any family member was born outside the United States and “0” for all other responses.
2.2.5. Sex
Parents identified the sex of the children as female or male. Sex was recoded as “1” for females, and “0” for males.
2.2.6. Age
Age was calculated starting with age in months at the time of the interview (“interview age”) divided by 12.
2.2.7. General socioeconomic status (SES)
Using Principal Components Analysis (PCA), we computed a general factor of SES based on seven substantially correlated indicators, which explained 42% of the variance. The loadings on the first factor were: financial adversity (.31), area deprivation index (.49), neighborhood safety protocol (.31), parental education (.54), parental income (.66), parental marital status (.43), and parental employment status (.23). We used the PCA mixdata R package (Chavent et al., 2014) to analyze these data, since this algorithm handles mixed categorical and continuous data. Fuerst et al. (2021) provide more details on this variable.
2.2.8. Predicted European appearance
As interviewer-rated phenotype is often unreliable and influenced by interviewer characteristics and as we only had phenotypic data for a small subset of the sample, we created genetic predictors of phenotype for analysis of the main sample. Specifically, we used tanning ability and hair pigment polyfun scores from Weissbrod et al. (2022; note that the SNP weights for these phenotypes were first published at the beginning of 2020) and skin color, hair color, and eye color probabilities calculated using the HIrisPlex-S web application (https://hirisplex.erasmusmc.nl/). To create a genetic index of European appearance, we employed PGSs developed by Weissbrod et al. (2020; 2022) for tanning propensity and hair pigment. These were created by applying genome-wide functionally-informed fine-mapping to individuals of British descent in the UK Biobank. These scores likely better estimate causal effects, thus reducing the likely adverse effects on between-population portability stemming from the impacts of linkage phase disequilibrium differences between populations (Weissbrod et al., 2020; Weissbrod et al., 2022).
The HIrisPlex-S web application, developed for use by the US Department of Justice in forensic investigations, and validated on thousands of people from around the world (Chaitanya et al., 2018; Walsh et al., 2017; Walsh et al., 2014), imputes probabilities for skin, hair, and eye color based on 41 SNPs that are functionally related to what could broadly be termed color traits (of these 36 were for skincolor, 22 for hair color, and six for eyecolor, with overlap). HIrisPlex-S gives probabilities that a given individual occupies a level associated with the Fitzpatrick Scale skin type (i.e., Type I, scores 0–6, “palest, freckles”; Type II, scores 7–13; Type III-IV (combined), scores 14–27; Type V, scores 28–34; Type VI, scores 35–36, this being associated with “deeply pigmented dark brown to darkest brown”). We weighted the medium score of each Type (e.g., Type I = 3) by the probability of each type to create a singular color measure. For hair color, HIrisPlex-S gives probabilities of light as opposed to dark hair color. For eye color, HIrisPlex-S gives probabilities of blue, intermediate, and dark eye color. We summed the blue and intermediate colors to create the light eye color probability.
The five phenotypic predictor scores, all based on functionally-informed SNPs, overlapped due to pleiotropy, meaning that different traits are co-influenced by a common set of genes. Because of these pleiotropic relationships, we were able to use factor analysis, yielding summary scores. Specifically, we factor-analyzed the tanning ability, hair pigment, skin color, hair color, and eye color scores, using the built-in R command factanal. This command function fits a common factor model using maximum likelihood estimation. A single-factor model explained 81% of the variance, and the loadings were: tanning ability .96, hair pigment .98, skin color .89, hair color .88, and eye color .79. We centered and standardized these scores in the full sample of 10,370 children. The correlation matrices are shown in Table 1.
Table 1. Correlation matrices for European genetic ancestry, predicted European appearance, and genetically predicted hair, skin, and hair color scores.
a. Black-Hispanic-Other sample (N =4459)
| Variable | M | SD | 1 | 2 | 3 | 4 | 5 | 6 | |||||||
| 1. European ancestry | 0.44 | 0.28 | |||||||||||||
| 2. European appearance | -0.89 | 0.79 | .84** | ||||||||||||
| [.83, .85] | |||||||||||||||
| 3. UKBB tanning ability | -0.85 | 0.87 | .85** | .95** | |||||||||||
| [.84, .86] | [.95, .96] | ||||||||||||||
| 4.UKBB hair pigment | -0.88 | 0.80 | .82** | .99** | .92** | ||||||||||
| [.81, .83] | [.99, .99] | [.92, .92] | |||||||||||||
| 5. HirisPlex
skin color |
-0.82 | 0.81 | .67** | .82** | .78** | .77** | |||||||||
| [.66, .69] | [.81, .83] | [.76, .79] | [.76, .79] | ||||||||||||
| 6. HirisPlex hair color | 0.21 | 0.29 | .64** | .84** | .75** | .80** | .71** | ||||||||
| [.62, .66] | [.83, .84] | [.73, .76] | [.79, .81] | [.69, .72] | |||||||||||
| 7. HirisPlex eye color | 0.13 | 0.26 | .52** | .71** | .59** | .68** | .63** | .73** | |||||||
| [.50, .54] | [.69, .72] | [.57, .61] | [.67, .70] | [.61, .65] | [.71, .74] | ||||||||||
b. Black-Hispanic-Other-White sample (N =10,370)
| Variable | M | SD | 1 | 2 | 3 | 4 | 5 | 6 |
| 1. European ancestry | 0.75 | 0.33 | ||||||
| 2. European Appearance | 0.00 | 1.00 | .89** | |||||
| [.89, .89] | ||||||||
| 3. UKBB tanning ability | 0.00 | 1.00 | .89** | .97** | ||||
| [.89, .89] | [.96, .97] | |||||||
| 4. UKBB hair pigment | 0.00 | 1.00 | .88** | .99** | .94** | |||
| [.88, .89] | [.99, .99] | [.94, .95] | ||||||
| 5. HirisPlex skin color | 0.00 | 1.00 | .80** | .90** | .87** | .87** | ||
| [.79, .80] | [.89, .90] | [.87, .88] | [.86, .87] | |||||
| 6. HirisPlex hair color | 0.53 | 0.39 | .77** | .89** | .82** | .87** | .77** | |
| [.76, .78] | [.89, .89] | [.82, .83] | [.86, .87] | [.77, .78] | ||||
| 7. HirisPlex eye color | 0.44 | 0.41 | .66** | .80** | .70** | .78** | .74** | .79** |
| [.65, .67] | [.79, .80] | [.69, .71] | [.77, .79] | [.73, .75] | [.79, .80] |
Note. M and SD are used to represent mean and standard deviation, respectively. Values in square brackets indicate the 95% confidence interval for each correlation. The confidence interval is a plausible range of population correlations that could have caused the sample correlation. * indicates p < .05. ** indicates p < .01.
2.2.9. European Phenotype
The ABCD twin data contained race-related phenotypic ratings for N = 239 individuals (after removing one MZ twin from each MZ twin pair). There were two ordinal-scale ratings for each phenotype. The phenotypes were as follows:
(1) Hair color (“zyg_ss_t1_hair_dark”; “zyg_ss_t2_hair_dark”) which was rated
as “0” = light, “1” = medium, “2” = dark, and which we reverse-coded.
(2) Hair pigment (“zyg_ss_t1_hair_col”; “zyg_ss_t2_hair_col”) which was rated as “0” = light blond, “1” = blond, “2” = red, “3” = brown, “4” = black, and which we reverse-coded.
(3) Eye color (“zyg_ss_t1_eye_col”; “zyg_ss_t2_eye_col”); this scale was originally rated as “0” = blue, “1” = gray, “2” = green, “3” = hazel, “4” = brown, and we recoded this scale as follows: light (blue, grey, and green) = “1” and dark (hazel & brown) = “0”.
(4) Hair form, based on the sum of scores from hair texture (“zyg_ss_t1_hair_txtr”; “zyg_ss_t2_hair_txtr”), which was rated as “0” = coarse, “1” = medium, “2” = fine, and hair type (“zyg_ss_t1_hair_type”; “zyg_ss_t2_hair_type”) which was rated as “0” = curly, and “1” = wavy, “2” = straight.
Higher values were associated with a more typical European hair form.
Since we had data from two raters, we were able to compute reliability estimates. Internal consistency coefficients (ICC) estimates and their 95% confidence –
intervals were calculated using the Psych statistical package (Revelle & Revelle, 2015). These values were based on a mean rating (k = 2), absolute-agreement, one-way random model (i.e., ICC1k; Koo & Li, 2016). The one-way model used phenotypic data sourced from two data collection sites (02 and 19). The one-way model is recommended in cases such as these (Koo & Li, 2016). Hair color, hair pigment, eye color, and hair form had average reliabilities [and confidence intervals] of .67 [.59, .73], .68 [.82, .88], 84 [.80, .87], and .89 [.86, .91], respectively. These values indicate moderate to good reliability (Koo & Li, 2016), so we used the average of ratings in subsequent analyses. Moreover, the four phenotype scores were strongly correlated with European ancestry (rs = .44 to .57); the correlation matrices are shown in Table 2.
To create rated-European phenotype scores, we factor-analyzed the scores using the R command factanal. A single-factor model explained 35% of the variance, and the loadings were as follows: hair color .46, hair pigment .74, eye color .71, and hair form .36. We centered and standardized these scores on the subsample of 239 individuals with phenotypic data.
Table 2. Correlation matrices for European genetic ancestry, genetically predicting European appearance, phenotypic European appearance, and specific phenotypes in the twin sample with phenotypic ratings (N = 239).
| Variable | M | SD | 1 | 2 | 3 | 4 | 5 | 6 |
| 1. European ancestry
|
0.85 | 0.21 | ||||||
| 2. Predicted
European appearance |
0.00 | 1.00 | .79** | |||||
| 3. Phenotypic
European appearance |
0.00 | 1.00 | .71** | .76** | ||||
|
4. Phenotype: light hair |
0.00 | 1,00 | .44** | .48** | .54** | |||
|
5. Phenotype: hair pigment |
0.00 | 1.00 | .56** | .61** | .87** | .34** | ||
|
6. Phenotype: light eyes |
0.00 | 1.00 | .57** | .64** | .83** | .32** | .53** | |
|
7. Phenotype: fine hair form |
0.00 | 1.00 | .53** | .43** | .43** | .21** | .26** | .25** |
Note. M and SD are used to represent mean and standard deviation, respectively. * indicates p < .05. ** indicates p < .01. N = 239.
The correlation between our genetically predicted European appearance and rated European phenotype was r = .76, which can be regarded as high-magnitude (Gignac & Szodorai, 2016). Notably this correlation was higher than that with global ancestry at r = .71, as would be expected if our variable predicted physical appearance above and beyond genetic ancestry. The ICCs for genetically predicted European appearance and rated European phenotype (N = 239) were .80 and .89 for single and average raters, respectively. For the Black-Hispanic-Other subsample (N = 88), these ICCs were .75 and .86, respectively. These magnitudes are usually interpreted to mean good reliability (Koo & Li, 2016).
2.2.10. Race and ethnicity fraction and Hispanic
Based on the 18 questions asking about the child’s race, we created four dummy race and ethnicity variables: Black, White, Native American, and Not Otherwise Classified (NOC).
The NOC category included those identified as “Other Race,” “Refused to answer,” or “Don’t Know”. Asians and Pacific Islanders were previously excluded and so were not included in the NOC category. We transformed these variables into interval race and ethnicity variables. These were calculated as the value selected for each of the four groups (0 or 1) over the total number of responses (0 to 4). Thus, individuals were assigned four race and ethnicity fractions ranging from 0 to 1. We used the White interval variable as the benchmark group. As a result, this variable is dropped from the regression models. As with ancestry, we leave these variables unstandardized so that the unstandardized beta coefficients for race and ethnicity fraction can be interpreted as a change in 100 percent race and ethnicity identity for every standardized unit of the dependent variable. We further create a variable for Hispanic ethnicity, coded as “1” for “Hispanic” and “0” for non-Hispanic. The correlation matrices for the predicted European appearance, genetic ancestry, and race and ethnicity variables, based on the Black-Hispanic-Other-White sample, are shown in Table 3.
Table 3. Correlation matrices for predicted European appearance, genetic ancestry, and race and ethnicity in the Black-Hispanic-Other-White sample (N = 10,370).
| Variable | M | SD | 1 | 2 | 3 | 4 | 5 | 6 | 7 | 8 |
| 1. Predicted European appearance | 0.00 | 1.00 | ||||||||
| 2. European ancestry | 0.75 | 0.33 | .89** | |||||||
| 3. African ancestry | 0.18 | 0.31 | -.78** | -.89** | ||||||
| 4. Amerindian
ancestry |
0.06 | 0.14 | -.32** | -.31** | -.13** | |||||
| 5. frac White | 0.73 | 0.43 | .77** | .86** | -.83** | -.13** | ||||
| 6. frac Black | 0.20 | 0.38 | -.72** | -.83** | .95** | -.17** | -.82** | |||
| 7. frac Native
American |
0.02 | 0.11 | -.03** | -.03** | -0.01 | .08** | -.18** | -.05** | ||
| 8. frac NOC | 0.06 | 0.23 | -.21** | -.19** | -.03** | .49** | -.41** | -.13** | -.04** | |
| 9. Hispanic | 0.19 | 0.40 | -.27** | -.22** | -.12** | .76** | -.07** | -.17** | .04** | .38** |
Note. M and SD are used to represent mean and standard deviation, respectively. * indicates p < .05. ** indicates p < .01.
2.2.11. eduPGS
To create educational polygenic scores (PGS), we scored the genomes using PLINK v1.90b6.8. We used the multi-trait analysis of genome-wide association study (MTAG) eduPGS SNPs (N = 8,898 variants in this sample) to compute eduPGS, and we based ourselves on the results from the genome-wide association study (GWAS) of Lee et al. (2018). These scores were based on educational attainment (N = 1,131,881), cognitive ability (N = 257,841), hardest math class taken (N = 430,445), and mathematical ability (N = 564,698) (Lee et al., 2018). Previous research has shown these scores to have good predictive validity in European populations, and reasonable trans-ethnic predictive validity in Hispanic, and African-American populations (Fuerst et al., 2021; Lasker et al., 2019).
2.3. Analysis
2.3.1 Validation of European Phenotypic Predictor
To validate our genetic predictor of European appearance, we ran two analyses. First, we ran regression models in which we predicted parentally-identified-child-racial category (White = “1”; non-White = “0”) based on our European phenotypic predictor, with European genetic ancestry controlled. While racial classifications in the US are primarily based on perceived continental ancestry (Harris, 2008; Hall, 2020), skin color has been found to influence the classifications independently of ancestry (Schachter, Flores & Maghbouleh, 2021). Thus, we expected European appearance to predict the identified race of the child, independently of genetic ancestry.
In line with the recommendation of Heeringa and Berglund (2021), we used a linear mixed-effects model rather than ordinary least squares. Linear mixed-effects involve partially decomposing the residual term into linear random effects components linked to the data-collection-site identifiers and same-family identifiers within the sample. This allows for the possibility of error term correlations within data collection sites or within families with multiple tested individuals (see: Heeringa & Berglund, 2021). This specification replicates that which was used by the ABCD Data Exploration and Analysis Portal (DEAP), and so the use of this multilevel model also aids in replication. To run these analyses, we employed the lmer command from the
lme4 package (Bates, Mächler, Bolker, & Walker, 2015).
As noted in Section 2.2.9 our European phenotype predictor had excellent reliability. So, second, using the subsample for which we had phenotypic ratings, we examine the degree to which our genetically predicted European appearance variable predicted rated European phenotype independently of genetic ancestry and, in supplemental analyses, race and ethnicity. We expect our appearance predictor to have validity as a predictor of rater reported appearance above and beyond global genetic ancestry. Since, we only had two sample sites and since we dropped one of two MZ twins we ran ordinary least square (OLS) for simplicity. However, we also report results based on linear mixed-effects, controlling for site, in Tab 2 of the supplementary file.
2.3.2 Main regression analyses
We next ran a series of regression analyses, using mixed-effects models, in which g or parentally-reported grades was the dependent variable and European appearance was the main independent variable. We ran five models, which sequentially added (parentally-identified) racial and ethnic category, SES, and ancestry, and both ancestry and SES to the initial regression model. The expectation was that if the colorism model was correct, predicted European appearance would retain validity when we added race and ethnicity, SES, and ancestry. In running these models, we followed a methodology similar to that of Telles and Paschel (2014) and Telles, Flores, and Urrea-Giraldo (2015), except that we also added genetic ancestry to the models. So, we followed established models of analyzing these kinds of data.
For the analyses with g (and also cognitive subtests), we used the mixed-effects model discussed above. However, parent-reported school grades showed a strong censoring effect (A = 49%; B = 36%; C to F = 15%), with many individuals receiving the highest grade of an A and the distribution not being normal. Therefore, we also ran analyses for grades using tobit regression, which adjusts for censored data, since censoring can induce effects resembling model misspecification. For these analyses, we used the tobit function in the AER package (Kleiber et al., 2020). No package for multilevel tobit regression is available for R, so for these tobit regression analyses we dropped the site and family random effects and included dummy variables for recruitment site instead. This is a suboptimal method, so we ran all analyses using both the standard mixed-effects model based on linear regression and the tobit regression models and compared the results. We also assessed the degree of collinearity for the European appearance variable, using the variance inflation factor (VIF) statistic. We used the car statistical package (Fox and Weisberg, 2011) to calculate the values of VIF.
2.3.3 Causal mediation analyses
Following the suggestion of Huddleston and Montgomery (2010), we ran causal mediation analysis using the mediation R package (Tingley et al., 2013). This package estimates both the mediation effect and the proportion of the effect that is directly causally mediated. We ran analyses with g as a mediator of the relation between grades and either European ancestry or European appearance. We ran these analyses both in the Black-Hispanic-Other-White sample and the Black-Hispanic-Other sample. European ancestry, European appearance, sex, age, child US-born, immigrant family, race and ethnicity, and interview site are included as covariates in all of the mediation analyses. Since this package cannot handle two levels of random effects, we dropped the family level from the analyses when using the mixed-effects model. We alternatively ran the models using linear regression for g and tobit regression for grades, in which case site effects were included as dummy variables.
2.3.4 Robustness analyses
Finally, as a robustness check, we reran the main regression analyses using the UKBB tanning and the HIrisPlex skin color variables instead of European appearance. This was done because theorists of colorism put the causal role of skin-color-based discrimination central (Marira & Mitra, 2013), and it may be that our European appearance variable is obscuring the relation between skin color and academic outcomes by also taking into account hair and eye color. We also reran the main analyses on the Hispanic and Black subsamples independently to determine if effects were present in subgroups. This was done because researchers using sibling designs have reported significant appearance-related effects among Hispanics (Ryaboy, 2016) without these effects being present in the full sample (Kizer, 2017). It may be that there are appearance-related effects among Hispanics or Blacks but not in the combined sample.
Additionally, we ran the analyses on all eleven cognitive subtests used to create g scores, and the NIH toolbox crystallized and fluid ability scales since it is possible that discriminatory effects will be localized on certain measures of cognitive ability. Differences might be expected to be more pronounced on crystallized measures since crystallized intelligence is “more heavily influenced by education and cultural exposure” (Akshoomoff, 2014, p. 120) and since theorists of colorism argue that colorism will manifest as a barrier to learning opportunities.
We further tested for possible cross-trait assortative mating by examining if eduPGS scores predict European appearance, tanning, and color independent of European ancestry. If there was cross-trait assortative mating, we would expect a substantial effect of eduPGS on these traits independent of European genetic ancestry. Norris (2019) reports polygenic evidence of assortative mating for education among Latin-American populations, while Zou et al. (2015) report evidence of assortative mating on European appearance. So, it is plausible that there was simultaneous assortative mating on both European appearance and education. While generally not mentioned by theorists of colorism, cross-trait assortative mating has long been hypothesized to explain advantages associated with European appearance in admixed American populations (e.g., Jensen, 1998; Reuter, 1917; Valenzuela, 2011).
2.4. Data and code
The R-code and additional model outputs are included in the supplementary file, available at Open Science Frame: https://osf.io/jqkns/. ABCD data are available to qualified researchers at: https://nda.nih.gov/abcd.
3.1. Validation
Table 4 shows the regression results for predicting White racial and ethnic categorization. Model 1 shows the results for the Black-Hispanic-Other sample, while Model 2 shows the results for the Black-Hispanic-Other-White sample. Model 1a and Model 2a include only European ancestry as the predictor, while Model 1b and Model 2b include all non-European ancestries as predictors. We note that our genetically-predicted European appearance variable predicts participant race and ethnicity independently of genetic ancestry. The effect is small, as expected, because race and ethnicity in the US are mostly understood in terms of ancestry.
Table 4. Regression models with genetically-predicted European appearance as the key independent variable and white racial and ethnic categorization as the dependent variable using the Black-Hispanic-Other sample (Model 1) and the Black-Hispanic-Other-White sample (Model 2).
| Model 1a:
Race/ethnicity, Appearance, & European Ancestry |
Model 1b:
Race/ethnicity, Appearance, & non-European Ancestries |
Model 2a:
Race/ethnicity, Appearance, & European Ancestry |
Model 2b:
Race/ethnicity, Appearance, & non-European Ancestries |
|||||||
| Predictors | b | P | b | P | b | P | b | P | ||
| (Intercept) | -0.10 | 0.005 | 0.76 | <0.001 | -0.14 | <0.001 | 0.94 | <0.001 | ||
| (0.04) | (0.03) | (0.02) | (0.02) | |||||||
| Predicted European appearance | 0.03 | 0.004 | 0.02 | 0.017 | 0.02 | <0.001 | 0.02 | <0.001 | ||
| (0.01) | (0.01) | (0.00) | (0.00) | |||||||
| European ancestry | 0.88 | <0.001 | 1.07 | <0.001 | ||||||
| (0.03) | (0.01) | |||||||||
| Child
US Born |
0.04 | 0.071 | 0.04 | 0.124 | 0.05 | 0.001 | 0.04 | 0.003 | ||
| (0.02) | (0.02) | (0.01) | (0.01) | |||||||
| Immigrant Family | 0.14 | <0.001 | 0.06 | <0.001 | 0.07 | <0.001 | 0.02 | <0.001 | ||
| (0.01) | (0.01) | (0.01) | (0.01) | |||||||
| African ancestry | -0.92 | <0.001 | -1.13 | <0.001 | ||||||
| (0.03) | (0.01) | |||||||||
| Amerindian ancestry | -0.35 | <0.001 | -0.67 | <0.001 | ||||||
| (0.04) | (0.02) | |||||||||
| East Asian ancestry | -0.96 | <0.001 | -0.81 | <0.001 | ||||||
| (0.13) | (0.08) | |||||||||
| South Asian ancestry | -1.14 | <0.001 | -1.00 | <0.001 | ||||||
| (0.21) | (0.13) | |||||||||
|
Random Effects |
||||||||||
| σ2 | 0.02 | 0.01 | 0.01 | 0.01 | ||||||
| τ00 | 0.08 site_id_l:rel_family_id | 0.07 site_id_l:rel_family_id | 0.04 site_id_l:rel_family_id | 0.03 site_id_l:rel_family_id | ||||||
| 0.00 site_id_l | 0.01 site_id_l | 0.00 site_id_l | 0.00 site_id_l | |||||||
| ICC | 0.85 | 0.84 | 0.8 | 0.79 | ||||||
| N | 22 site_id_l | 22 site_id_l | 22 site_id_l | 22 site_id_l | ||||||
| 3863 rel_family_id | 3863 rel_family_id | 8672 rel_family_id | 8672 rel_family_id | |||||||
| Observations | 4459 | 4459 | 10370 | 10370 | ||||||
| Marginal R2 / Conditional R2 | 0.464 / 0.918 | 0.527 / 0.925 | 0.739 / 0.948 | 0.754 / 0.948 | ||||||
Note: Beta coefficients (b) and p-values (p) from the mixed-effects models, with recruitment site and family common factors treated as random effects are shown. The values in parentheses are standard errors. The marginal and conditional R2s of the mixed-effects model are shown at the bottom. ICC = Intraclass Correlation Coefficient.
Next, Table 5 shows the regression results for predicting interviewer rated phenotype based on genetically predicted European appearance in the small twin sample that had phenotypic ratings. Model 1 shows the results without genetic ancestry, while models 2a and 2b add European ancestry and non-European ancestries, respectively. We note that our genetically predicted European appearance variable predicts interviewer-rated European phenotype over and above genetic ancestry. The results, for the equivalent Model 2a, are substantially the same when we subset to the 88 Blacks, Hispanics, and Others in the twin sample (Predicted European appearance b = .59; S.E. = .11) or when we additionally include parental reported race in the models. These additional results are provided in Table 2 of the supplementary file.
Table 5. Regression models with genetically predicted European appearance as the key independent variable and interviewer-rated phenotype as the dependent variable.
|
|
Model 1:
Phenotype ~ Predicted Phenotype |
Model 2a:
Phenotype ~ Predicted Phenotype w/European ancestry |
Models 2b:
Phenotype ~ Predicted Phenotype w/non-European Ancestries |
|||
| Predictors | b | P | b | P | b | P |
| (Intercept) | 0.04 (0.06) |
0.469 | -1.09 (0.27) |
<0.001 | 0.28 (0.09) |
0.001 |
| European appearance | 0.76 (0.04) |
<0.001 | 0.54 (0.07) |
<0.001 | 0.53 (0.07) |
<0.001 |
| Sex | -0.09 (0.08) |
0.286 | -0.08 (0.08) |
0.309 | -0.07 (0.08) |
0.360 |
| European ancestry | 1.32 (0.31) |
<0.001 | ||||
| African ancestry | -1.14 (0.33) |
0.001 | ||||
| Amerindian ancestry | -1.61 (0.45) |
<0.001 | ||||
| East Asian ancestry | -2.18 (3.10) |
0.483 | ||||
| South Asian ancestry | -11.22 (13.97) |
0.423 | ||||
| Observations | 239 | 239 | 239 | |||
| R2 / R2 adjusted | 0.584 / 0.581 | 0.614 / 0.610 | 0.619 / 0.610 | |||
Notes: Beta coefficients (b) and p-values (p) from the OLS regression models. The values in parentheses are standard errors. The marginal and conditional R2 of the mixed effects model are shown at the bottom.
3.2 Main results
Table 6 shows the main results with g as the dependent variable for the Black-Hispanic-Other sample. Its Model 1 reveals that the relation between predicted European appearance and g is statistically significant. When we add race and ethnicity in Model 2, this relation is reduced but still statistically significant. When we add SES, in Model 3, the effect is further reduced but still statistically significant. However, when we add genetic ancestry in Model 4a (without SES) and 4b (with SES) the relation becomes statistically non-significant. The results for the Black-Hispanic-Other-White sample, provided in the supplementary material, also reveal no statistically significant effect when adding European ancestry in Model 4a (without SES) and 4b (with SES).
Table 7 shows the main results, again for the Black-Hispanic-Other sample, using grades as the dependent variable. In this table, tobit regression is used. Model 1 reveals that the relation between predicted European appearance and grades is statistically significant. When we add race and ethnicity in Model 2, this relation is reduced but is still statistically significant. When we add SES, in Model 3, the effect is further reduced but is still statistically significant. Adding genetic ancestry in Models 4a and 4b (with SES) does not change this.
However, in the final Model (4b), the relation is only marginally statistically significant (p = 0.042). In contrast, the results for the Black-Hispanic-Other-White sample, provided in the supplementary material, show no statistically-significant effect of European appearance in Model 4a (without SES) and 4b (with SES). Moreover, the effects of European appearance in the Black-Hispanic-Other-White sample are trivial. Thus, the effect of European appearance on parent-reported grades only shows up in the Black-Hispanic-Other sample.
Table 6. Regression results for the effect of predicted European appearance on g in the Black-Hispanic-Other sample.
| M1: g ~ European appearance | M2: g ~ European appearance + race and ethnicity | M3: g ~ European appearance + race and ethnicity + SES | M4a: g ~ European appearance + race and ethnicity + European ancestry | M4b: g ~ European appearance + race and ethnicity + European ancestry + SES | ||||||||||||
| Predictors | b | P | b | P | b | P | b | P | b | P | ||||||
| Intercept | 0.31 (0.25) |
0.22 | 0.42 (0.26) |
0.11 | 0.38 (0.25) |
0.14 | -0.62 (0.28) |
0.03 | -0.28 (0.27) |
0.30 | ||||||
| age | -0.05 (0.02) |
0.03 | -0.05 (0.02) |
0.03 | -0.05 (0.02) |
0.03 | -0.04 (0.02) |
0.06 | -0.05 (0.02) |
0.04 | ||||||
| sex | 0.02 (0.03) |
0.45 | 0.03 (0.03) |
0.37 | 0.04 (0.03) |
0.22 | 0.02 (0.03) |
0.44 | 0.03 (0.03) |
0.26 | ||||||
| Predicted European appearance | 0.34 (0.02) |
<0.01 | 0.25 (0.03) |
<0.01 | 0.15 (0.03) |
<0.01 | 0.03 (0.04) |
0.41 | 0.01 (0.03) |
0.72 | ||||||
| Child US Born | 0.05 (0.08) |
0.55 | 0.05 (0.08) |
0.54 | 0.13 (0.08) |
0.09 | 0.07 (0.08) |
0.37 | 0.14 (0.08) |
0.07 | ||||||
| Immigrant Family | 0.25 (0.04) |
<0.01 | 0.20 (0.04) |
<0.01 | 0.12 (0.04) |
0.04 | 0.22 (0.04) |
<0.01 | 0.14 (0.04) |
0.01 | ||||||
| Frac Black | -0.31 (0.07) |
<0.01 | -0.23 (0.07) |
0.02 | 0.08 (0.08) |
0.36 | 0.02 (0.08) |
0.83 | ||||||||
| Frac Native American | -0.10 (0.12) |
0.40 | -0.05 (0.11) |
0.66 | -0.07 (0.12) |
0.58 | -0.03 (0.11) |
0.78 | ||||||||
| Frac NOC | -0.19 (0.06) |
0.01 | -0.07 (0.05) |
0.18 | -0.07 (0.06) |
0.23 | -0.00 (0.05) |
0.93 | ||||||||
| Hispanic | -0.05 (0.06) |
0.38 | -0.01 (0.05) |
0.86 | -0.04 (0.06) |
0.45 | -0.01 (0.05) |
0.86 | ||||||||
| SES | 0.35 (0.02) |
<0.01 | 0.32 (0.02) |
<0.01 | ||||||||||||
| European ancestry | 1.24 (0.13) |
<0.01 | 0.79 (0.12) |
<0.01 | ||||||||||||
| Random Effects | ||||||||||||||||
| σ2 | 0.52 | 0.52 | 0.51 | 0.51 | 0.51 | |||||||||||
| τ00 | 0.52 site_id_l:rel_family_id | 0.52 site_id_l:rel_family_id | 0.43 site_id_l:rel_family_id | 0.50 site_id_l:rel_family_id | 0.43 site_id_l:rel_family_id | |||||||||||
| 0.02 site_id_l | 0.02 site_id_l | 0.04 site_id_l | 0.02 site_id_l | 0.04 site_id_l | ||||||||||||
| ICC | 0.51 | 0.51 | 0.48 | 0.51 | 0.48 | |||||||||||
| N | 22 site_id_l | 22 site_id_l | 22 site_id_l | 22 site_id_l | 22 site_id_l | |||||||||||
| 3863 rel_family_id | 3863 rel_family_id | 3863 rel_family_id | 3863 rel_family_id | 3863 rel_family_id | ||||||||||||
| Observations | 4459 | 4459 | 4459 | 4459 | 4459 | |||||||||||
| Marginal R2 / Conditional R2 | 0.085 / 0.549 | 0.095 / 0.556 | 0.180 / 0.571 | 0.116 / 0.565 | 0.187 / 0.574 | |||||||||||
Notes: Beta coefficients (b) and p-values (p) from the mixed-effects models, with recruitment site and family common factors treated as random effects are shown. The values in parentheses are standard errors. The marginal and conditional R2 of the mixed effects model are shown at the bottom. ICC = Intraclass Correlation Coefficient.
Table 7. Tobit regression results for the effect of predicted European appearance on grades in the Black-Hispanic-Other sample.
| M1: Grades ~ European appearance | M2: Grades ~ European appearance + SIRE | M3: Grades ~ European appearance + SIRE + SES | M4a: Grades ~ European appearance + SIRE + European ancestry | M4b: Grades ~ European appearance + SIRE + European ancestry + SES | ||||||||||
| Predictors | b | P | b | p | b | P | b | P | b | P | ||||
| Age | -0.03 (0.03) |
0.27 | -0.03 (0.03) |
0.30 | -0.04 (0.03) |
0.24 | -0.03 (0.03) |
0.34 | -0.03 (0.03) |
0.25 | ||||
| Sex | 0.29 (0.04) |
<0.01 | 0.29 (0.04) |
<0.01 | 0.29 (0.04) |
<0.01 | 0.29 (0.04) |
<0.01 | 0.29 (0.04) |
<0.01 | ||||
| European appearance | 0.21 (0.02) |
<0.01 | 0.20 (0.03) |
<0.01 | 0.12 (0.03) |
<0.01 | 0.10 (0.04) |
0.01 | 0.09 (0.04) |
0.04 | ||||
| Child US Born | -0.07 (0.10) |
0.50 | -0.08 (0.10) |
0.43 | -0.03 (0.10) |
0.77 | -0.07 (0.10) |
0.47 | -0.03 (0.10) |
0.78 | ||||
| Immigrant Family | 0.07 (0.04) |
0.12 | 0.08 (0.05) |
0.12 | 0.03 (0.05) |
0.55 | 0.09 (0.05) |
0.08 | 0.03 (0.05) |
0.49 | ||||
| Frac Black SIRE | 0.00 (0.09) |
0.99 | 0.05 (0.09) |
0.54 | 0.16 (0.10) |
0.11 | 0.11 (0.10) |
0.25 | ||||||
| Frac Native American SIRE | 0.12 (0.14) |
0.36 | 0.15 (0.13) |
0.27 | 0.13 (0.14) |
0.33 | 0.15 (0.13) |
0.26 | ||||||
| Frac NOC SIRE | -0.13 (0.07) |
0.06 | -0.06 (0.07) |
0.40 | -0.08 (0.07) |
0.23 | -0.04 (0.07) |
0.55 | ||||||
| Hispanic | 0.03 (0.07) |
0.62 | 0.07 (0.07) |
0.27 | 0.04 (0.07) |
0.55 | 0.07 (0.07) |
0.26 | ||||||
| SES | 0.22 (0.02) |
<0.01 | 0.22 (0.02) |
<0.01 | ||||||||||
| European ancestry | 0.50 (0.15) |
0.01 | 0.19 (0.15) |
0.20 | ||||||||||
| Observations | 3814 | 3814 | 3814 | 3814 | 3814 | |||||||||
| R2 Nagelkerke | 0.056 | 0.058 | 0.089 | 0.061 | 0.089 | |||||||||
Notes: Beta coefficients (b) and p-values (p) from the tobit models, with recruitment site (not shown) added as dummy variables. The values in parentheses are standard errors.
Table 8, Model 1 shows the alternative multi-level regression results. For these, when we add genetic ancestry in Models 4a and 4b (with SES), the relation becomes statistically non-significant, although the model approaches statistical significance in the case of 4a (without SES) (p = 0.06). The results for the Black-Hispanic-Other-White sample, provided in the supplementary material, show no statistically significant effect of European appearance in Model 4a (without SES) and 4b (with SES). The discrepancy between the tobit and multilevel regression results could be due to not including random effects in the latter or due to censoring-related bias in the former. Regardless, the betas for both 4b models are fairly similar (b = .09 vs. b = .06) and suggest some unaccounted-for European appearance-related effect on parent-reported student grades.
Table 8. Mixed-effects regression results for the effect of predicted European appearance on grades in the Black-Hispanic-Other Sample.
| M1: Grades ~ European appearance | M2: Grades ~ European appearance + race and ethnicity | M3: Grades ~ European appearance + race and ethnicity + SES | M4a: Grades ~ European appearance + race and ethnicity + European ancestry | M4b: Grades ~ European appearance + race and ethnicity + European ancestry + SES | |||||||||||
| Predictors | b | P | b | P | b | P | b | P | b | P | |||||
| (Intercept) | 0.45 (0.29) |
0.11 | 0.42 (0.29) |
0.15 | 0.46 (0.29) |
0.11 | -0.03 (0.31) |
0.93 | 0.26 (0.31) |
0.40 | |||||
| Age | -0.06 (0.03) |
0.03 | -0.06 (0.03) |
0.04 | -0.06 (0.03) |
0.02 | -0.05 (0.03) |
0.04 | -0.06 (0.03) |
0.02 | |||||
| Sex | 0.34 (0.03) |
<0.01 | 0.34 (0.03) |
<0.01 | 0.34 (0.03) |
<0.01 | 0.34 (0.03) |
<0.01 | 0.34 (0.03) |
<0.01 | |||||
| Predicted European appearance | 0.19 (0.02) |
<0.01 | 0.17 (0.03) |
<0.01 | 0.10 (0.03) |
0.01 | 0.08 (0.04) |
0.06 | 0.06 (0.04) |
0.13 | |||||
| Child US Born | -0.15 (0.09) |
0.10 | -0.17 (0.09) |
0.07 | -0.11 (0.09) |
0.24 | -0.15 (0.09) |
0.09 | -0.10 (0.09) |
0.26 | |||||
| Immigrant Family | 0.04 (0.04) |
0.36 | 0.04 (0.05) |
0.38 | -0.02 (0.05) |
0.62 | 0.05 (0.05) |
0.27 | -0.02 (0.05) |
0.73 | |||||
| Frac Black | -0.00 (0.08) |
0.97 | 0.05 (0.08) |
0.54 | 0.16 (0.09) |
0.08 | 0.12 (0.09) |
0.19 | |||||||
| Frac Native American | 0.03 (0.13) |
0.81 | 0.07 (0.12) |
0.60 | 0.04 (0.13) |
0.74 | 0.07 (0.12) |
0.58 | |||||||
| Frac NOC | -0.20 (0.06) |
0.01 | -0.13 (0.06) |
0.03 | -0.14 (0.06) |
0.02 | -0.11 (0.06) |
0.07 | |||||||
| Hispanic | 0.05 (0.06) |
0.40 | 0.07 (0.06) |
0.26 | 0.06 (0.06) |
0.34 | 0.07 (0.06) |
0.24 | |||||||
| SES | 0.22 (0.02) |
<0.01 | 0.21 (0.02) |
<0.01 | |||||||||||
| European_ancestry | 0.53 (0.14) |
<0.01 | 0.23 (0.14) |
0.10 | |||||||||||
| Random Effects | |||||||||||||||
| σ2 | 0.76 | 0.75 | 0.75 | 0.75 | 0.75 | ||||||||||
| τ00 | 0.32 site_id_l:rel_family_id | 0.32 site_id_l:rel_family_id | 0.29 site_id_l:rel_family_id | 0.32 site_id_l:rel_family_id | 0.29 site_id_l:rel_family_id | ||||||||||
| 0.01 site_id_l | 0.01 site_id_l | 0.00 site_id_l | 0.01 site_id_l | 0.00 site_id_l | |||||||||||
| ICC | 0.30 | 0.30 | 0.28 | 0.30 | 0.28 | ||||||||||
| N | 22 site_id_l | 22 site_id_l | 22 site_id_l | 22 site_id_l | 22 site_id_l | ||||||||||
| 3296 rel_family_id | 3296 rel_family_id | 3296 rel_family_id | 3296 rel_family_id | 3296 rel_family_id | |||||||||||
| Observations | 3814 | 3814 | 3814 | 3814 | 3814 | ||||||||||
| Marginal R2 / Conditional R2 | 0.048 / 0.338 | 0.051 / 0.339 | 0.086 / 0.339 | 0.056 / 0.343 | 0.087 / 0.340 | ||||||||||
Notes: Beta coefficients (b) and p-values (p) from the mixed-effects models, with recruitment site and family common factors treated as random effects, are shown. The values in parentheses are standard errors. The marginal and conditional R2s of the mixed-effects model are shown at the bottom. ICC = Intraclass Correlation Coefficient.
We additionally computed the values of variance inflation factors (VIFs), which measure the amount of multicollinearity in a regression analysis. In cases of high multicollinearity, it can be difficult to distinguish between the effects of individual independent variables owing to high correlations among these. The full results for these tests for excessive multicollinearity are provided in Tab 5 of the supplementary file. For the Black-Hispanic-Other sample, the values of VIFs for predicted European appearance in Models 4a to 4b of Tables 6-8 ranged from 2.9 to 3.6. For the Black-Hispanic-Other-White sample, VIFs for predicted European appearance ranged from 4.0 to 4.6. Usually, a VIF value > 5 or, less strictly, > 10 is said to be problematic (James et al., 2013), but the values found here for European appearance are lower than these commonly-used thresholds, indicating that multicollinearity is not likely to be confounding our results. We also ran the models dropping the frac_SIRE variables, which, in the presence of European appearance, were leading to collinearity with European ancestry. As expected, doing so decreased the values of VIFs for European ancestry but did not substantially change the results.
3.3. Mediation analysis
The results from the causal mediation analyses are summarized in Table 9. The full results are provided in Tab 6 of the supplementary file. In both the Black-Hispanic-Other and the Black-Hispanic-Other-White samples, g was a substantial and statistically significant mediator of the relation between genetic ancestry and grades. In contrast, g was not a statistically significant mediator of the relation between European appearance and grades. In the Black-Hispanic-Other sample, European appearance had a significant total effect on grades (p = .03) with the same magnitude of effect as in Model M4a of table 7. Nonetheless, g was not a statistically significant mediator of the relation between predicted European appearance and grades.
Table 9. Summary of the causal mediation results for the full sample and race and ethnicity subsamples.
| Method: LMER | ||||||||
| Predictor | Mediator | Criterion | Mediation Effect | Proportion
of total effect mediated |
N | |||
| Black-Hispanic-Other | ||||||||
| Predicted European appearance | g | grades | 0.02 [ -0.01, 0.05] | 0.26 | 4459 | |||
| European Ancestry | g | grades | 0.53 [ 0.41, 0.66] | 1.03 | 3814 | |||
|
Black-Hispanic-Other-White |
||||||||
|
Predicted European appearance |
g | grades | 0.01 [-0.01, 0.03] | 0.25 | 10370 | |||
| European Ancestry | g | grades | 0.61 [0.53, 0.71] | 0.75 | 9128 | |||
| Method: LM-Tobit | ||||||||
| Predictor | Mediator | Criterion | Mediation Effect | Proportion
of total effect mediated |
N | |||
|
Black-Hispanic-Other |
||||||||
|
Predicted European appearance |
g | grades | 0.02 [ -0.01, 0.06] | 0.24 | 4459 | |||
| European Ancestry | g | grades | 0.54 [ 0.43, 0.67] | 1.12 | 3814 | |||
|
Black-Hispanic-Other-White
|
||||||||
| Predicted European appearance | g | grades | 0.01 [-0.01, 0.02] | 0.25 | 10370 | |||
| European Ancestry | g | grades | 0.52 [0.44, 0.60] | 0.83 | 9128 | |||
Notes: Statistically significant results (p < 0.05) are presented in bold.
3.4 Robustness analyses
As a robustness check, we reran the main regression analyses using the UKBB tanning and the HIrisPlex skin color variables instead of European appearance. These results are reported in Tab 8 and Tab 9 of the supplementary file. Neither the effects of UKBB tanning nor the effects of HIrisPlex skin color were close to significant for g or grades. So, using a composite indicator of hair, eye, and skin tanning/color instead of skin tanning/color alone did not decrease the effects. Rather, effects, particularly for grades, were stronger when using the European appearance predictor.
Next, we reran the main analyses on both the Hispanic (n = 2021 to 1741) and non-Hispanic Black (n = 1690 to 1432) subsamples. These results are shown in Tab 10 of the supplementary file. Again, European appearance, tanning, and color were not significantly related to either g or grades in the Hispanic and Black subsamples.
Additionally, we ran the analyses on all eleven cognitive subtests used to create g scores in addition to the NIHTBX fluid and crystallized composite scores. These results, for the Black-Hispanic-Other sample, are shown in Tab 13 of the supplementary file. We found statistically significant results only for the Picture Vocabulary test (b = 0.097; S.E. = .033), but not the other crystallized test, namely Oral Reading Recognition (b = 0.000; S.E. = .034). We also found marginally significant results for the crystallized composite scores (b = 0.068; S.E. = .033), which were due to the highly significant results for Picture Vocabulary, since the crystallized composite was derived from the Picture Vocabulary and Oral Reading Recognition tests. These results for crystallized composite scores and for Picture Vocabulary scores could represent a real effect, since it seems more likely that appearance-based discrimination would be present on a measure of knowledge and crystallized cognitive ability than fluid ability. Alternatively, this could represent a coincidence due to multiple testing (i.e., looking at the effects on eleven independent measures).
Finally, we tested for possible cross-trait assortative mating by examining if eduPGS scores predicted European appearance independent of European ancestry. These results are shown in Tab 11 of the supplementary file. We did not find significant associations between eduPGS and European appearance independent of European ancestry, which is inconsistent with the cross-trait assortative mating hypothesis.
4.1. Discussion
The colorism model states that there is ongoing discrimination based on physical appearance in the Americas, which contributes to the link between European phenotype and better social outcomes. This model predicts that European appearance, regardless of ancestry, will have a positive impact on academic outcomes. We tested the colorism model using the admixture-regression methodology. Specifically, we hypothesized, first, that European appearance would be related to g when taking into account genetic ancestry, and second, that European appearance would have a relationship with grades independent of genetic ancestry. However, we found no substantial evidence to support the first hypothesis and only limited evidence to support the second. As a result, our findings do not strongly support the colorism hypothesis.
Additionally, due to meta-analyses showing a significant connection between g and grades, we formulated two more hypotheses: third, that g would play a role in the relationship between European ancestry and grades, and fourth, that g would play a role in the relationship between European appearance and grades. Our findings provided strong evidence for the third hypothesis, but not for the fourth hypothesis. This suggests that the relationship between European ancestry and grades is dependent on g, while the relationship between European appearance and grades is not dependent on g.
We conducted several robustness tests. When we used tanning or color, instead of European appearance, as the main predictor, we did not find any significant statistical connections between these two variables and either g or grades. Moreover, we did not find statistically significant associations when subsetting to the two largest admixed groups, Hispanics and Blacks. The lack of an association between either tanning or color and academic outcomes further weakens a colorism model, since this model places primacy on “the causal role of skin tone in engendering the colorism phenomenon” (Marira & Mitra, 2013, p. 103). So, we conclude that the outcomes are robust, and that the results of the robustness tests did not support a colorism model.
Across 15 outcome measures (g, grades, eleven subtests, the fluid ability composite, and the crystallized ability composite), three traits (European appearance, UKBB tanning, and HIrisPlex skin color), and four groupings (Black-Hispanic-Other-White, Black-Hispanic-Other, Black, and Hispanic) we found three statistically significant results, two of which were redundant (i.e., the effect on Crystalized intelligence resulted from the effect on Picture Vocabulary). Given that 15 different overlapping academic outcomes were examined across three traits, these results could simply be chance results due to multiple testing. Moreover, the interpretation of the results for grades is complicated since the grades were parent-reported, not actual school-reported grades, and since the parent-reported grades were very course (e.g., mostly As, mostly Bs, mostly Cs, etc.).
On the other hand, the three statistically significant results may make theoretical sense. Theorists of colorism have argued that colorism will manifest as a barrier to learning opportunities (Thompson & McDonald, 2016) and optimal education (Crutchfield et al., 2022), acting against less European-appearing students. On this basis, it is reasonable to hypothesize that the effects would be larger on crystalized abilities and outcomes dependent on teachers’ judgment. Therefore, future research should attempt to evaluate whether there are robust European-appearance effects on measures of crystalized ability and grades.
Regarding the general lack of association with respect to cognitive ability, one could perhaps argue that global genetic ancestry is a better predictor of overall racial appearance. Accordingly, discrimination might be based on an overall assessment of morphological differences, not just conspicuous race-associated differences in skin, eye, and hair color. However, this is somewhat different from what “colorists” have narrowly hypothesized, hence the term “colorism”. If race-associated discrimination is said to be based on ancestry-indexing phenotypes, then perhaps a good alternative term might be “ancestrysim”. It is not clear, though, why discrimination would be finely tuned to overall phenotypic markers of genetic ancestry instead of features that are stereotypic of racial groups.
A more likely explanation for these findings is that color is associated with cognitive ability predominantly because the color phenotype proxies global ancestry. Global ancestry could be related to how differences in these characteristics are inherited or passed on from parents to children along genealogical lines. Several researchers have argued that genetic ancestry might index social disparities intergenerationally transmitted for cultural, genetic, or epigenetic reasons (Corach & Caputo, 2022; da Silva et al., 2020; Fuerst & Kirkegaard, 2016). This possibility has largely been not discussed by sociologists who have focused instead on discriminatory or diffuse cultural models concerning disparities by caste, nation, ethnicity, or race. Our results suggest that researchers should also focus on genetic ancestry and identifying the specific genetic, epigenetic, and cultural factors which mediate the intergenerational transmission of academic outcomes.
4.2. Limitations
One could argue that our genetic predictor of European appearance is not perfectly reliable. However, frequently used skin tone scales, such as the Massey and Martin (2003) scale, have been found to have low reliabilities (Hannon & DeFina, 2016; 2020), so we would argue, based on our own results, that our genetically-predicted European appearance scores appear to be more reliable than the sorts of color measures which are typically used. A genetic-based predictor of color captures phenotype over an individual’s lifetime without the variability due to the low reliability of interviewer rating skin tone scales which have been found to be influenced by interviewer-rated characteristics such as race/ethnicity (Campbell et al., 2020; Cernat et al., 2019) or the interviewer’s perceptions about the participants socioeconomic status (Roth et al., 2022). So, we conclude that a genetic predictor of European appearance is preferable to interviewer-rated skin tone.
It is possible that there are substantial ancestry-independent associations between color and academic outcomes in other populations or for other academic traits. The novel admixture-regression method described here can be used to investigate if this is the case.
4.3 Implications
We focused on Hispanic, Black, Other, and White Americans. This is because, according to Marira and Mitra (2013, p. 104), “the most rigorous research concerning the nexus of colorism and labor market outcomes has been conducted on African American and Latino populations in the United States”. Given that the best support for colorism is said to come from the study of Black and Hispanic Americans, we would have expected the association between European appearance/color and academic outcomes to be robust in this sample. However, we did not find this to be the case, which weakens the colorism hypothesis.
Author contributions: All analyses were conducted by JGRF under the supervision of B. J. Pesta while at Cleveland State University (2020-2021). VS helped write and edit the paper.
Acknowledgments: Data used in the preparation of this article were obtained from the Adolescent Brain Cognitive Development (ABCD) Study (https://abcdstudy.org), held in the NIMH Data Archive (NDA). This is a multisite, longitudinal study designed to recruit more than 10,000 children aged 9-10 and follow them over 10 years into early adulthood. The ABCD Study® is supported by the National Institutes of Health and additional federal partners under award numbers U01DA041048, U01DA050989, U01DA051016, U01DA041022, U01DA051018, U01DA051037, U01DA050987, U01DA041174, U01DA041106, U01DA041117, U01DA041028, U01DA041134, U01DA050988, U01DA051039, U01DA041156, U01DA041025, U01DA041120, U01DA051038, U01DA041148, U01DA041093, U01DA041089, U24DA041123, U24DA041147. A full list of supporters is available at https://abcdstudy.org/federal-partners.html. A listing of participating sites and a complete listing of the study investigators can be found at https://abcdstudy.org/consortium_members/. ABCD consortium investigators designed and implemented the study and/or provided data, but did not necessarily participate in the analysis or writing of this report. This manuscript reflects the research results and interpretations of the authors alone and may not reflect the opinions or views of the NIH or ABCD consortium investigators. The ABCD data repository grows and changes over time. The ABCD data used in this report came from Version 3.01. The raw data are available at https://nda.nih.gov/edit_collection.html?id=2573. Additional support for this work was made possible from supplements to U24DA041123 and U24DA041147, the National Science Foundation (NSF 2028680), and Children and Screens: Institute of Digital Media and Child Development Inc. NDA waved the requirement of creating a NDA data project (NDA, Oct 26, 2022).
4.4. Conclusions
We found little support for the colorism hypothesis. Our results suggest that the relationship between racial appearance and academic outcomes cannot be considered as prima facie evidence of discrimination, as genetic ancestry, and the inherited disadvantage associated with it, is a plausible confounding variable. In future studies on colorism, it is recommended to consider genetic ancestry as a factor in the analyses. Because discrimination is such an important topic, it is essential that more studies are carried out before we are able to draw strong conclusions.
- Abascal, M., & Garcia, D. (2022). Pathways to Skin Color Stratification: The Role of Inherited (Dis) Advantage and Skin Color Discrimination in Labor Markets. Sociological Science, 9, 346-373.
- Akshoomoff, N., Beaumont, J. L., Bauer, P. J., Dikmen, S. S., Gershon, R. C., Mungas, D., … & Heaton, R. K. (2013). VIII. NIH Toolbox Cognition Battery (CB): Composite scores of crystallized, fluid, and overall cognition. Monographs of the Society for Research in Child Development, 78(4), 119-132.
- Bates, D., Mächler, M., Bolker, B. & Walker, S. (2015). Fitting linear mixed-effects models using lme4. Journal of Statistical Software, 67(1), 1–48.
- Bucca, M. E. (2018). Socioeconomic Inequality Among Racial Groups in the United States(Doctoral dissertation, Cornell University).
- Campbell, M. E., Keith, V. M., Gonlin, V., & Carter-Sowell, A. R. (2020). Is a picture worth a thousand words? An experiment comparing observer-based skin tone measures. Race and Social Problems, 12(3), 266-278.
- Campos-Vazquez, R. M., & Medina-Cortina, E. M. (2019). Skin color and social mobility: Evidence from Mexico. Demography, 56(1), 321-343.
- Cernat, A., Sakshaug, J. W., & Castillo, J. (2019). The Impact of interviewer effects on skin color assessment in a cross-national context. International Journal of Public Opinion Research, 31(4), 779-793.
- Chaitanya, L., Breslin, K., Zuñiga, S., Wirken, L., Pośpiech, E., Kukla-Bartoszek, M., … & Walsh, S. (2018). The HIrisPlex-S system for eye, hair and skin colour prediction from DNA: Introduction and forensic developmental validation. Forensic Science International: Genetics, 35, 123-135.
- Chavent, M., Kuentz-Simonet, V., Labenne, A. & Saracco, J. (2014). Multivariate analysis of mixed data: The R Package PCAmixdata. arXiv.1411.4911
- Connor, G., & Fuerst, J.G.R. (2023). Linear and Partially Linear Models of Behavioral Trait Variation Using Admixture Regression. In Lynn, R. (Ed.). Intelligence, Race and Sex: Some Controversial Issues: A Tribute to Helmuth Nyborg at 85. London: Arktos.
- Corach, D., & Caputo, M. (2022). Social injustice unveiled by genetic analysis: Argentina as a case study. American Journal of Human Biology, e23820.
- Crutchfield, J., Keyes, L., Williams, M., & Eugene, D. R. (2022). A Scoping Review of Colorism in Schools: Academic, Social, and Emotional Experiences of Students of Color. Social Sciences, 11(1), 15.
- da Silva, A. K. L. S., Madrigal, L., & da Silva, H. P. (2020). Relationships among genomic ancestry, clinical manifestations, socioeconomic status, and skin color of people with sickle cell disease in the State of Pará, Amazonia, Brazil. Antropologia Portuguesa, (37), 159-176.
- Dixon, A. R., & Telles, E. E. (2017). Skin color and colorism: Global research, concepts, and measurement. Annual Review of Sociology, 43(1), 405-424.
- Fox, J., Weisberg, S., Adler, D., Bates, D., Baud-Bovy, G., Ellison, S., … & Monette, G. (2012). Package ‘car’. Vienna: R Foundation for Statistical Computing, 16.
- Francis-Tan, A. (2016). Light and shadows: an analysis of racial differences between siblings in Brazil. Social Science Research, 58, 254-265.
- Francis, A. M., & Tannuri-Pianto, M. (2012). The redistributive equity of affirmative action: Exploring the role of race, socioeconomic status, and gender in college admissions. Economics of Education Review, 31(1), 45–55.
- Fuerst, J. G., Hu, M., & Connor, G. (2021). Genetic ancestry and general cognitive ability in a sample of American youths. Mankind Quarterly, 62(1).
- Fuerst, J. G. (2021). Robustness analysis of African genetic ancestry in admixture regression models of cognitive test scores. Mankind Quarterly, 62(2).
- Fuerst, J. G., Lynn, R., & Kirkegaard, E. O. (2019). The Effect of Biracial Status and Color on Crystallized Intelligence in the US-Born African–European American Population. Psych, 1(1), 44-54.
- Gignac, G. E., & Szodorai, E. T. (2016). Effect size guidelines for individual differences researchers. Personality and Individual Differences, 102, 74-78.
- Hailu, S. (2018). Skin-Tone and Academic Achievement Among 5-year-old Mexican Children. Master’s Thesis, Virginia Commonwealth University Richmond, Richmond, VA, USA.
- Hall, R. E. (2020). The DuBoisian talented tenth: Reviewing and assessing mulatto colorism in the post-DuBoisian era. Journal of African American Studies, 24(1), 78-95.
- Hannon, L. (2014). Hispanic respondent intelligence level and skin tone: Interviewer perceptions from the American national election study. Hispanic Journal of Behavioral Sciences, 36(3), 265-283.
- Hannon, L., & DeFina, R. (2016). Reliability concerns in measuring respondent skin tone by interviewer observation. Public Opinion Quarterly, 80(2), 534-541.
- Hannon, L., & DeFina, R. (2020). The reliability of same-race and cross-race skin tone judgments. Race and Social Problems, 12(2), 186-194.
- Harris, A. P. (2008). From color line to color chart: Racism and colorism in the new century. The Berkeley Journal of African-American Law & Policy, 10, 52.
- Heeringa, S. G., & Berglund, P. A. (2020). A guide for population-based analysis of the Adolescent Brain Cognitive Development (ABCD) Study baseline data. BioRxiv. doi:https://doi.org/10.1101/2020.02.10.942011
- Hernández, T. K. (2015). Colorism and the law in Latin America-global perspectives on colorism conference remarks. Washington University Global Studies Law Review,14, 683.
- Hill, M. E. (2002). Skin color and intelligence in African Americans: A reanalysis of Lynn’s data. Population and Environment, 24(2), 209-214.
- Hochschild, J. L., & Weaver, V. (2007). The skin color paradox and the American racial order. Social Forces, 86(2), 643-670.
- Hu, M., Lasker, J., Kirkegaard, E. O., & Fuerst, J. G. (2019). Filling in the gaps: The association between intelligence and both color and parent-reported ancestry in the National Longitudinal Survey of Youth 1997. Psych, 1(1), 240-261.
- Huddleston, D. A., & Montgomery, L. (2010). A Scholarly Response to Shades of Black. In: Lewis, C., Jackson, J., Eds, pp. 63-76. Black in America: A Scholarly Response to the CNN Documentary.
- Hunter, M. L. (2013). The consequences of colorism. In R. E. Hall (Ed.), The melanin millennium: Skin color as 21st century international discourse (pp. 247–256). Springer Netherlands.
- James, G., Witten, D., Hastie, T., & Tibshirani, R. (2013). An introduction to statistical learning(Vol. 112). New York: Springer.
- Jensen, A. R. (1998). The g factor. Westport, CT: Prager.
- Kim, Y., & Calzada, E. J. (2019). Skin color and academic achievement in young, Latino children: Impacts across gender and ethnic group. Cultural Diversity and Ethnic Minority Psychology, 25(2), 220-231.
- Kim, J., Edge, M. D., Goldberg, A., & Rosenberg, N. A. (2021). Skin deep: The decoupling of genetic admixture levels from phenotypes that differed between source populations. American Journal of Physical Anthropology, 175(2), 406-421.
- Kirkegaard, E. O., Wang, M., & Fuerst, J. G. (2017). Biogeographic Ancestry and Socioeconomic Outcomes in the Americas: A Meta-Analysis. Mankind Quarterly, 57(3).
- Kizer, J. (2017). Skin color stratification and the family: Sibling differences and the consequences for inequality(Doctoral dissertation, UC Irvine).
- Kleiber, C., Zeileis, A., & Zeileis, M. A. (2020). Package ‘aer’. R package version, 12(4).
- Koo, T. K., & Li, M. Y. (2016). A guideline of selecting and reporting intraclass correlation coefficients for reliability research. Journal of Chiropractic Medicine, 15(2), 155-163.
- Kreisman, D., & Rangel, M. A. (2015). On the blurring of the color line: Wages and employment for Black males of different skin tones. Review of Economics and Statistics, 97(1), 1-13.
- Lasker, J., Pesta, B. J., Fuerst, J. G., & Kirkegaard, E. O. (2019). Global ancestry and cognitive ability. Psych, 1(1), 431-459.
- Lee, J. J., Wedow, R., Okbay, A., Kong, E., Maghzian, O., Zacher, M., … & Social Science Genetic Association Consortium. (2018). Gene discovery and polygenic prediction from a 1.1-million-person GWAS of educational attainment. Nature Genetics, 50(8), 1112.
- Leite, T. K., Fonseca, R. M., França, N. M. D., Parra, E. J., & Pereira, R. W. (2011). Genomic ancestry, self-reported “color” and quantitative measures of skin pigmentation in Brazilian admixed siblings. PloS one, 6(11), e27162.
- Liu, M. M., Crowe, M., Telles, E. E., Jiménez-Velázquez, I. Z., & Dow, W. H. (2022). Color disparities in cognitive aging among Puerto Ricans on the archipelago. SSM-Population Health, 17, 100998.
- Marira, T. D., & Mitra, P. (2013). Colorism: Ubiquitous yet understudied. Industrial and Organizational Psychology, 6(1), 103-107.
- Marteleto, L. J., & Dondero, M. (2016). Racial inequality in education in Brazil: A twins fixed-effects approach. Demography, 53(4), 1185-1205.
- Massey D., & Martin J. (2003). The NIS Skin Color Scale. Princeton, NJ: Princeton University Press.
- Mill, R. & Stein, L. (2016). Race, Skin Color, and Economic Outcomes in Early Twentieth-Century America. Available at SSRN: https://ssrn.com/abstract=2741797or http://dx.doi.org/10.2139/ssrn.2741797
- Mooney, J. A., Agranat-Tamir, L., Pritchard, J. K., & Rosenberg, N. A. (2022). On the number of genealogical ancestors tracing to the source groups of an admixed population. arXiv preprint arXiv:2210.12306.
- Norris, E. T., Rishishwar, L., Wang, L., Conley, A. B., Chande, A. T., Dabrowski, A. M., … & Jordan, I. K. (2019). Assortative mating on ancestry-variant traits in admixed Latin American populations. Frontiers in Genetics, 10, 359.
- Rangel, M. A. (2015). Is parental love colorblind? Human capital accumulation within mixed families. The Review of Black Political Economy, 42(1-2), 57-86.
- Reuter, E. B. (1917). The superiority of the mulatto. American Journal of Sociology, 23(1), 83-106.
- Revelle, W., & Revelle, M. W. (2015). Package ‘psych’. The comprehensive R archive network, 337, 338.
- Roth, B., Becker, N., Romeyke, S., Schäfer, S., Domnick, F., & Spinath, F. M. (2015). Intelligence and school grades: A meta-analysis. Intelligence, 53, 118-137.
- Roth, W. D., Solís, P., & Sue, C. A. (2022). Beyond money whitening: Racialized hierarchies and socioeconomic escalators in Mexico. American Sociological Review, 87(5), 827-859.
- Ryabov, I. (2013). Colorism and school-to-work and school-to-college transitions of African American adolescents. Race and Social Problems, 5(1), 15-27.
- Ryabov, I. (2016). Educational outcomes of Asian and Hispanic Americans: The significance of skin color. Research in Social Stratification and Mobility, 44, 1-9.
- Schachter, A., Flores, R. D., & Maghbouleh, N. (2021). Ancestry, color, or culture? How whites racially classify others in the US. American Journal of Sociology, 126(5), 1220-1263.
- Telles, E. (2004). Race in Another America: The Significance of Skin Color in Brazil. Princeton, N.J.: Princeton University Press.
- Telles, E., Flores, R. D., & Urrea-Giraldo, F. (2015). Pigmentocracies: Educational inequality, skin color and census ethnoracial identification in eight Latin American countries. Research in Social Stratification and Mobility, 40, 39-58.
- Telles, E., & Paschel, T. (2014). Who is black, white, or mixed race? How skin color, status, and nation shape racial classification in Latin America. American Journal of Sociology, 120(3), 864-907.
- Tingley, D., Yamamoto, T., Hirose, K., Keele, L., Imai, K., and Yamamoto, M. T. (2017). Package ‘Mediation’. https://imai.fas.harvard.edu/projects/mechanisms.html.
- Thompson, M. S., & McDonald, S. (2016). Race, skin tone, and educational achievement. Sociological Perspectives, 59(1), 91-111.
- Thompson, W.K., Barch, D.M., Bjork, J.M., Gonzalez, R., Nagel, B.J., Nixon, S.J. & Luciana, M. (2019). The structure of cognition in 9- and 10-year-old children and associations with problem – behaviors: Findings from the ABCD study’s baseline neurocognitive battery. Developmental Cognitive Neuroscience 36: 100606
- Walsh, S., Chaitanya, L., Breslin, K., Muralidharan, C., Bronikowska, A., Pospiech, E., … & Kayser, M. (2017). Global skin colour prediction from DNA. Human Genetics, 136(7), 847-863.
- Walsh, S., Chaitanya, L., Clarisse, L., Wirken, L., Draus-Barini, J., Kovatsi, L., … & Kayser, M. (2014). Developmental validation of the HIrisPlex system: DNA-based eye and hair colour prediction for forensic and anthropological usage. Forensic Science International: Genetics, 9, 150-161.
- Weissbrod, O., Hormozdiari, F., Benner, C., Cui, R., Ulirsch, J., Gazal, S., … & Price, A. L. (2020). Functionally informed fine-mapping and polygenic localization of complex trait heritability. Nature Genetics, 52(12), 1355-1363.
- Weissbrod, O., Kanai, M., Shi, H., Gazal, S., Peyrot, W. J., Khera, A. V., Okada, Y., Matsuda, K., Yamanashi, Y., Furucawa, Y., Morisaki, T., Murakami, Y., Kamatani, Y., Muto, K., Nagai, A., Obara, W., Yamaji, K., Takahashi, K., Asai, S., … Price, A. L. (2022). Leveraging fine-mapping and multipopulation training data to improve cross-population polygenic risk scores. Nature Genetics, 54(4), 1–9.
- Zou, J. Y., Park, D. S., Burchard, E. G., Torgerson, D. G., Pino-Yanes, M., Song, Y. S., … & Zaitlen, N. (2015). Genetic and socioeconomic study of mate choice in Latinos reveals novel assortment patterns. Proceedings of the National Academy of Sciences, 112(44), 13621-13626.